


What to know:
- XRP flashes rare Supertrend signal, historically triggering drops toward key support zones.
- Bears dominate as RSI weakens, EMAs resist, and long liquidations accelerate rapidly
- Analysts eye $0.70–$0.80 target zone before any meaningful XRP recovery begins.

XRP price analysis warns of a potential sharp downside move as bearish signals strengthen. Crypto analyst ChartNerd confirmed a rare Supertrend signal on XRP.
The signal has appeared only twice before in XRP history and previously led to retests of long-term support levels. According to CoinMarketCap, XRP trades near $1.31 with weak momentum over the short term.
XRP Price Analysis Is Showing Bearish Structure
According to TradingView data, the current setup shows weakness across all three main categories of price analysis, which are trend, momentum, and structure. The XRP price remains under the 50 EMA and has been stuck near the 20 EMA level. This alignment of EMAs also reflects continuous pressure from sellers in recent sessions.

RSI near 46 indicates weak momentum with room for further downside. However, if this continues, then it will provide room for another bounce back upwards.
MACD shows flat lines as well as no confirmation of a bullish crossover. These signs confirm the development of a new XRP bearish trend.
Also Read | XRP Moves Up as $1.80 Breakout Level and $0.83 Risk Define Market Direction
Derivative Data Shows Risk Of Downside
Data from CoinGlass shows cautious positioning by traders. Trade volume of futures contracts has sharply decreased, which is typical of reduced participation. Low network activity usually leads to weaker bullish continuation attempts.
Open interest remains constant, but liquidation data shows more long positions than short positions being wiped out. Such patterns usually occur when traders are positioned for an uptick and unexpectedly sell their holdings.
Similar patterns of liquidations precede additional downside or volatility spikes, reinforcing the developing XRP bearish trend.
Historical Pattern Points To Key Retest Zone
Bearish Supertrend signals have always resulted in structured retractions in the form of prices returning to major support/resistance levels in each case prior to the signal. The current higher low trend suggests that a similar outcome may unfold.
If the pattern holds true, XRP could return to the $0.80 and $0.70 range. This XRP price prediction corresponds to prior corrections prior to major bullish recoveries.
Invalidation exists clearly if price breaks descending resistance. If the price breaks through resistance, the bearish view is negated.
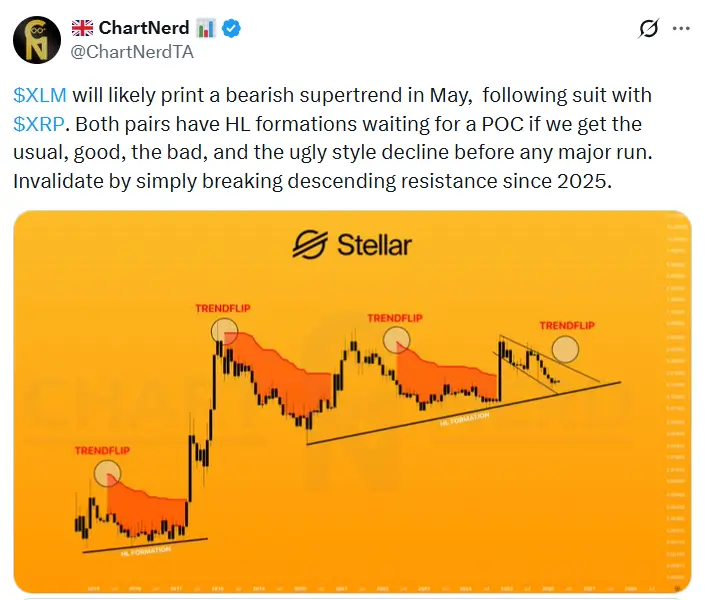
XLM Mirrors XRP Setup
Based on insights from ChartNerd, Stellar (XLM) has developed a very similar structure on higher timeframes to XRP. He expects a bearish trend flip to appear in May 2026.
Like XRP, XLM maintains a higher low trend line support Structure. The correlation between XLM and XRP strengthens the broader market outlook.
This article contains market analysis and price predictions. These are not guarantees. Crypto markets are volatile. Always DYOR. Not financial advice.
Also Read | XRP Price Breaks $1.31 — Is $0.87 the Next Target?

Be the first to comment