

What to know:
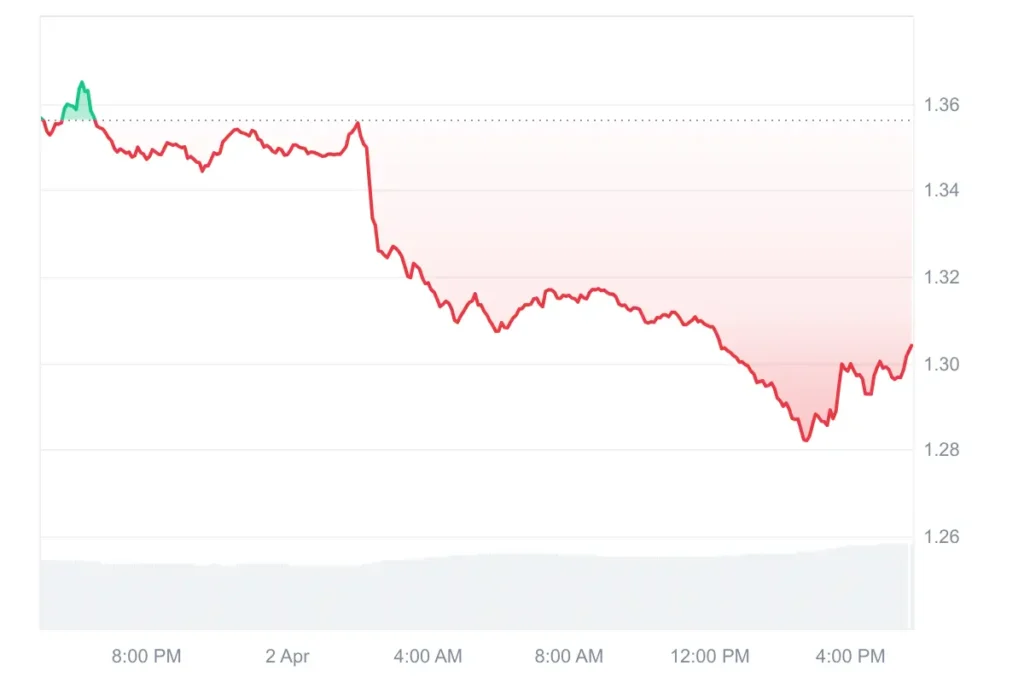
- XRP breaks below $1.31 support, confirming bearish momentum with a sharp 4% decline.
- Analyst CasiTrades warns that XRP could slide towards the $1.05 to $1.09 range next.
- Heavy liquidation zones near $1.10 and $0.90 may pull prices even lower soon.
XRP price dropped below the $1.31 support today, signaling increasing bearish pressure in the market. The move follows earlier projections from analyst CasiTrades, who warned of a possible continuation lower.
According to CoinMarketCap, XRP trades near $1.30 after a 4% decline in 24 hours. Trading volume rose by over 23%, indicating strong participation during the breakdown.
XRP Price Analysis Suggests More Weakness
CasiTrades stated that the break of the $1.31 support line creates a higher likelihood of continued downside. The XRP price analysis suggests additional downtrend as previous support levels have failed to hold. The analyst believes XRP will experience a price move toward the $1.05 to $1.09 area.

This price zone is supported by previously identified support areas from its price structure. TradingView data shows that XRP is currently trading under all three moving averages (EMAs) (the 20-day, 50-day, and 200-day EMAs).
This demonstrates long-term, sustained, strong downward pressure and weak short-term momentum. RSI (Relative Strength Index) is also around neutral levels, which implies that there is little buying force behind the price action.
MACD (Moving Average Convergence Divergence) is showing decreasing momentum and continues to show bearish continuation signals.
Also Read | XRP Slashes Massive Barriers in 2026 Global Payments
Liquidation Heat Map Reveals Downside Target Zones
Data from CoinGlass reveals several densely populated areas of liquidity beneath the present price of XRP. These dense areas of liquidity can act as zones that draw the token’s price into large liquidation zones.
There appears to be significant amounts of liquidity in the $1.10 to $0.90 range. This supports the analyst’s projection of a move to this same range as well as a subsequent price move to $0.87.
Data from CoinGlass shows average funding rates on XRP as being negative (-0.0087%). Negative funding indicates that traders are heavy in short positions, which can continue to contribute to the ongoing downtrend.
Open interest rose by more than 1.3%, while futures volumes expanded. Both figures indicate that new positions are being entered as the price declines.
New positions on the shorts’ side can create a continuation of the trend before a possible short squeeze occurs.
Open Interest & Volume Show Heavy Market Activity
Futures volume expanded to nearly $3.34 billion, based on CoinGlass data. Spot volume remains lower, and it is likely that this market is driven by leveraged capital flow.
Leverage can lead to extreme volatility and continue to support further downside risk. Derivatives activity currently drives the XRP price movements.
What’s Ahead For XRP Price
Based on this XRP price prediction, a decline toward the $1.05 to $1.09 region can be expected before any rebound occurs. A short-term relief rally may develop once the price reaches these areas.
CasiTrades mentioned that the temporary rebound could take shape as a Wave Four structure. She anticipates a secondary leg down toward the $0.87 support point, which is the last major support level within a macro retracement zone.
This article contains market analysis and price predictions. These are not guarantees. Crypto markets are volatile. Always DYOR. Not financial advice.
Also Read | XRP Price Down Nearly 30% in 2026: $1 Support Level in Focus

Be the first to comment