


What to know:
- XRP gains moderately but faces strong $1.40 resistance, keeping bullish momentum limited.
- Long-term patterns mirror the 2017 triangle setup, signaling potential for a significant breakout.
- Short-term indicators show weak momentum; RSI is below 50, and MACD remains negative.
XRP is experiencing moderate gains as investors assess the reduced momentum and levels of resistance. The overall direction of the asset’s price is uncertain, with technical indicators indicating that the strength of the bulls is low.
At the time of writing, XRP is trading at $1.35, and it has a trading volume of $2.65 billion and a market capitalization of $82.78 billion, according to CoinMarketCap. The value of the token has increased of 1.81% over the last 24 hours, and this shows that there is a positive growth in the value of the token.

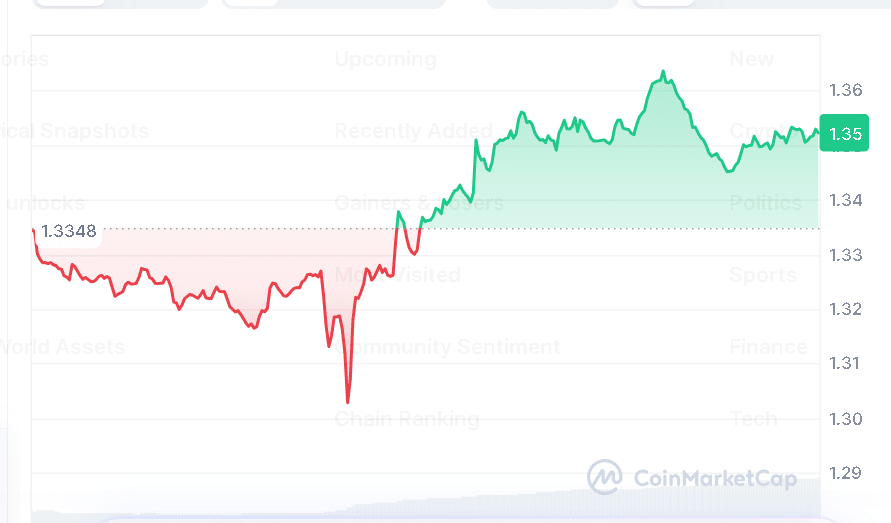
Source: CoinMarketCap

XRP Mirrors 2017 Triangle Setup
On March 30, 2026, crypto analyst ChartNerd highlighted on X that the long-term fractals of XRP are becoming more defined. According to ChartNerd, the long-term picture for XRP shows that the asset typically builds a symmetrical triangle structure that leads to a sharp move as the pattern matures.
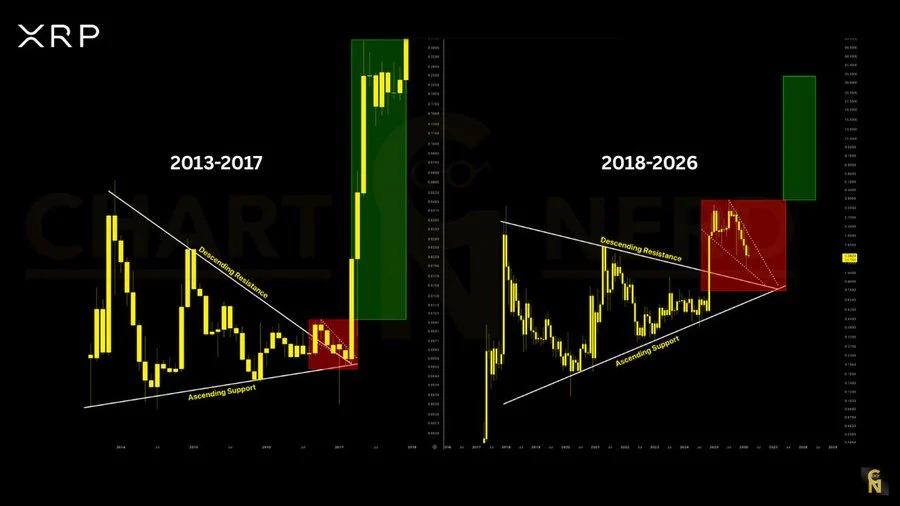

Source: ChartNerd’s X Post
The same pattern was observed in 2017, where the price rallied due to a breakout and subsequent retest. It appears that the pattern is repeating itself in 2026, which could mean a strong price move, although such formations don’t always mean the price will move in the same way.
Technical Indicators Show Weak Momentum
Despite the prospects of long-term setup, it is evident from the short-term technical analysis of XRP that it is still struggling to gain strength. In fact, the Relative Strength Index (RSI) of XRP is still at 42.92, which is lower than 50.
The price continues to remain below the moving average ribbon, and resistance levels are at $1.40, $1.40, $1.64, and $2.04. This indicates that XRP is in a mild state of downtrend, and it is necessary for the price to rise past these levels to change its current state.
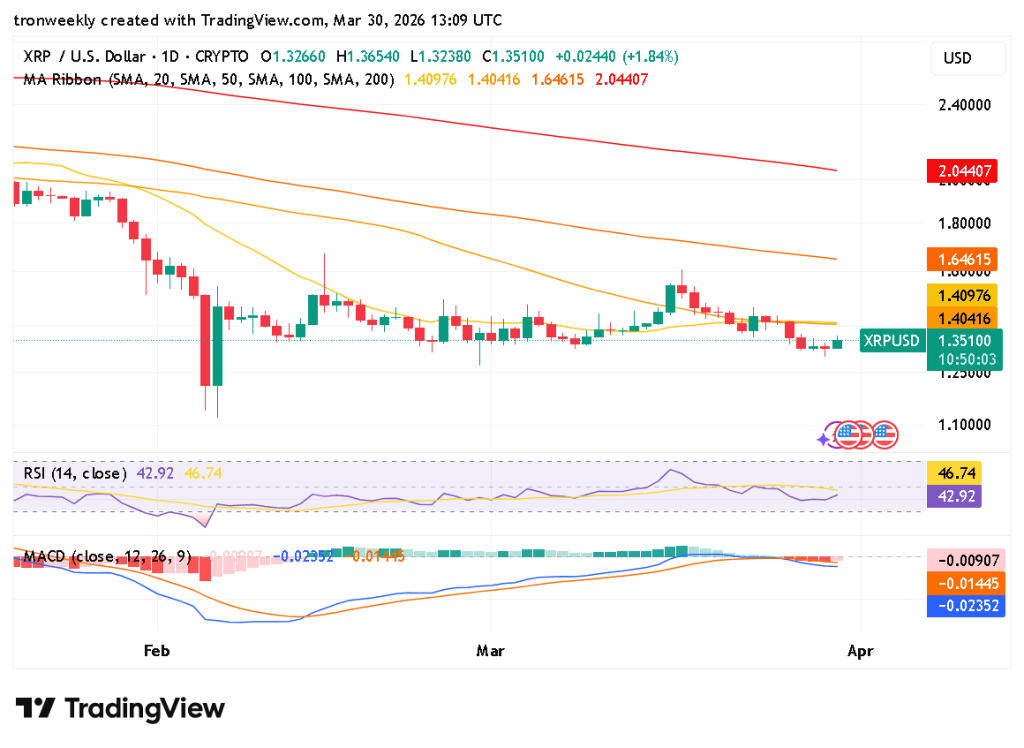
Source: TradingView
Meanwhile, the MACD indicator is still in negative territory with readings at -0.00907, -0.01445, and -0.02352. Although the histogram is continuing to shrink in size, it is still in negative territory. This means that the momentum of the bears is still not entirely gone. A potential crossover is forming, but it is not yet confirmed.
Also Read | Ripple’s Strategic Bet on Traditional Finance Unleashes Massive Growth in 2026
XRP at Crucial Trend Crossroads
In summary, it seems that the token is at a crossroads. Long-term charts indicate that the token may be ready to break out in the same way that it has in the past.
However, the current technical indicators indicate that the token is struggling with low momentum and resistance. A breakout above $1.40 may be positive for the token and indicate that the token’s trend is changing.
This article contains market analysis and price predictions. These are not guarantees. Crypto markets are volatile. Always DYOR. Not financial advice.
Also Read | Solana Pullback Intensifies, $60–$65 Fibonacci Zone Emerges Key Support

Be the first to comment