


What to know:
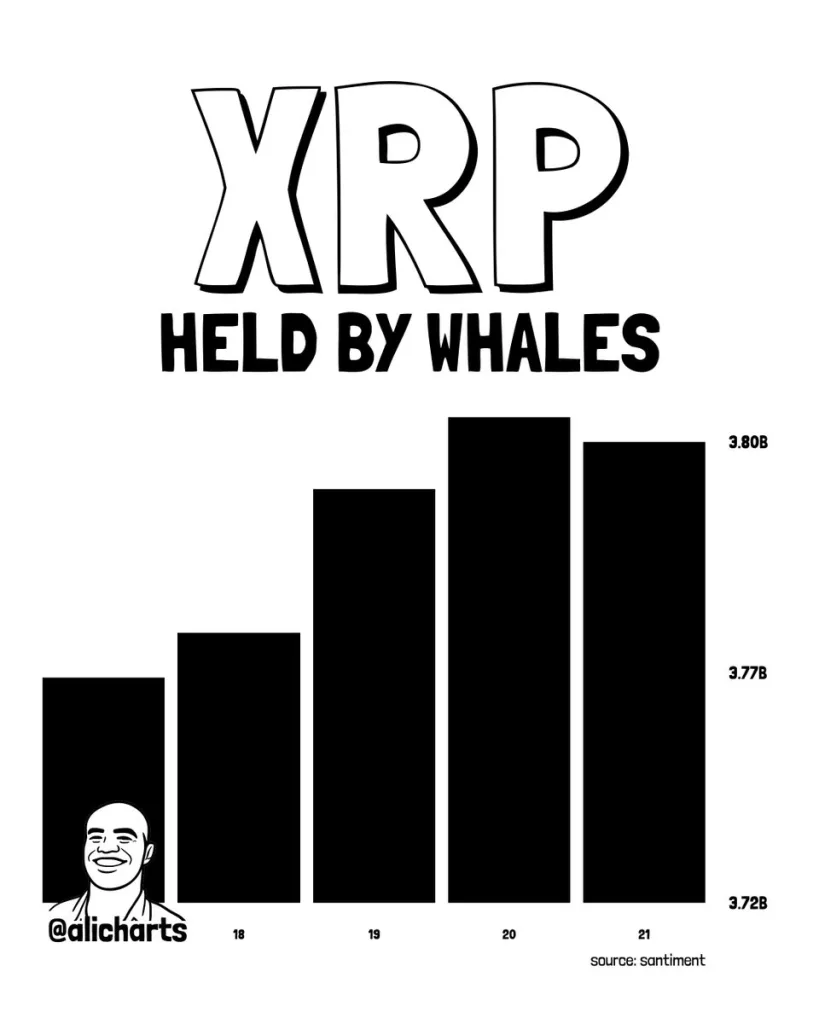
- XRP whales have quietly accumulated roughly 40 million tokens, signaling growing confidence in the cryptocurrency.
- The TD Sequential indicator shows a buy signal, suggesting XRP could rebound toward the $1.50 resistance level.
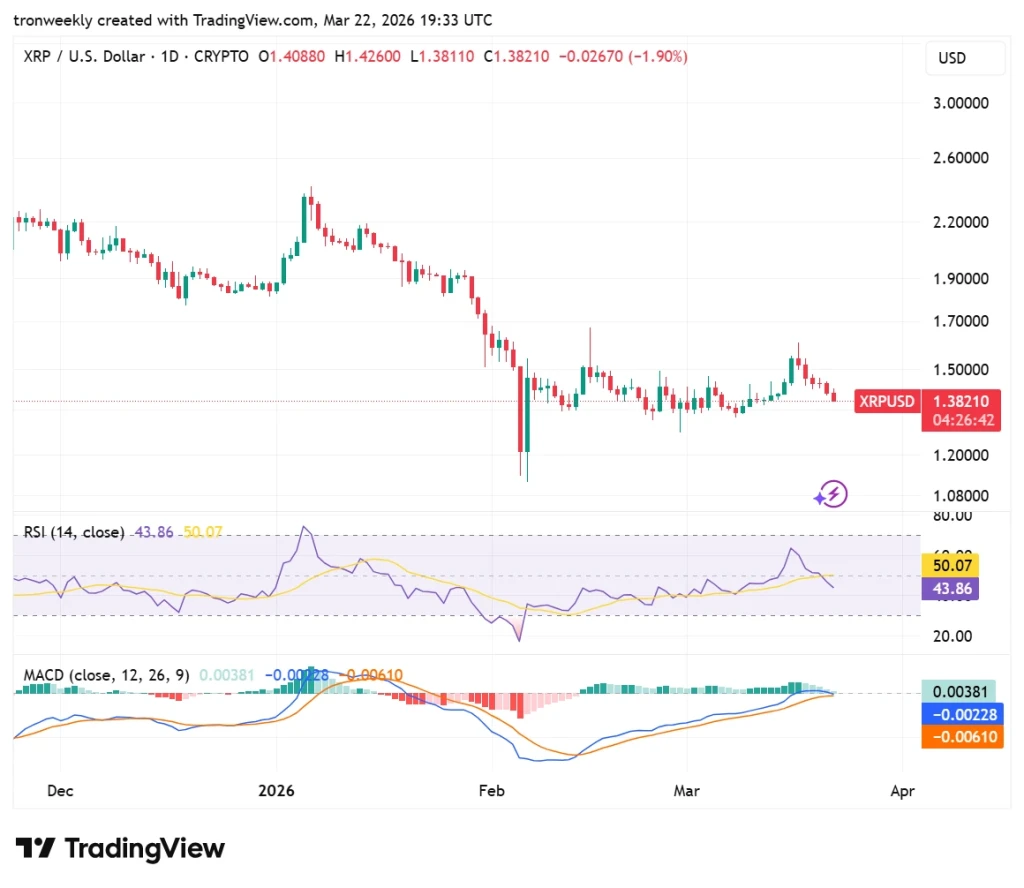
- RSI at 43.86 and a flattening MACD indicate bearish momentum is present but may be easing soon.


XRP whales have quietly accumulated roughly 40 million XRP over the past week, according to the crypto analyst Ali Charts, as of Sunday, March 22. Large holders, capable of influencing market trends, capitalized on recent price fluctuations to expand their positions.
Ali Charts notes this pattern reflects strategic confidence in XRP’s long-term potential and signals growing interest from institutional investors and high-net-worth traders.

Source: Ali Charts’ X Post
This surge in accumulation coincides with Ripple’s ongoing adoption and broader market developments. Concentrated whale buying is often interpreted as a bullish indicator, suggesting potential upward price pressure.
As macroeconomic factors and crypto-specific news shape sentiment, XRP’s recent whale activity highlights the increasing role of large investors in steering market dynamics, potentially impacting price trends in the coming weeks.
Also Read: XRP Network Hits New Highs as Market Awaits Price Direction in 2026
XRP Eyes $1.50 Rebound as TD Sequential Signals Buy
However, Ali Charts also revealed that XRP is seen to be recovering as the TD Sequential indicator, which is commonly used to identify trend reversals, is flashing a buy signal.
This is seen as a hint of a potential reversal as the selling pressure is subsiding. According to Ali Charts, the TD is showing signs of a potential reversal as the selling pressure is subsiding.

Source: Ali Charts’ X Post
If XRP is able to follow through, possible short-term resistances could be seen at $1.50, as it previously served as a significant price barrier.
Although TD Sequential signals do not guarantee a reversal, they are indicative of changes in sentiment. Market trends and movements in Bitcoin are being watched, as they tend to dictate the movements of altcoins.
Momentum Indicators Reveal Increasing Bearish Pressure
According to TradingView, the RSI (14) is currently at 43.86, tracking lower than its yellow moving average and the 50-neutral mark.
This suggests that the bearish momentum is currently higher than the buying pressure. The price has not yet fallen to the oversold level of 30, leaving room for further price falls before a trend reversal or a bottoming out.
Source: TradingView
The MACD indicates that the blue line is flattening close to the orange signal line, indicating that the upward momentum has stalled.
The histogram, although still in the green zone at 0.00381, indicates that the bars are decreasing, indicating that the recent upward move is losing momentum. A bearish crossover would be expected to take the price to the lows made in February.
This article contains market analysis and price predictions. These are not guarantees. Crypto markets are volatile. Always DYOR. Not financial advice.
Also Read: XRP Faces Pressure Below Key Levels, $2 Remains Possible on Recovery

Be the first to comment