


What to know:
- Zcash (ZEC) consolidates in a bullish upward trend as price stability strengthens after recent weekly gains.
- Technical breakout from a descending triangle pattern signals potential ZEC rally toward the $440 price target.
- RSI above 70 indicates overbought conditions, suggesting strong buying pressure but possible short-term correction.

Zcash (ZEC) is moving in an upward consolidation phase following early signs of bullishness in the crypto market. According to CoinMarketCap, the ZEC price has remained stable over the last 24 hours and 41.67% over the last week.
At the time of writing, ZEC is trading at $329.93, with a trading volume of $565.36 million, which is down by 44.55% over the last 24 hours. However, its market capitalization stands at $5.48 billion, which is stable.
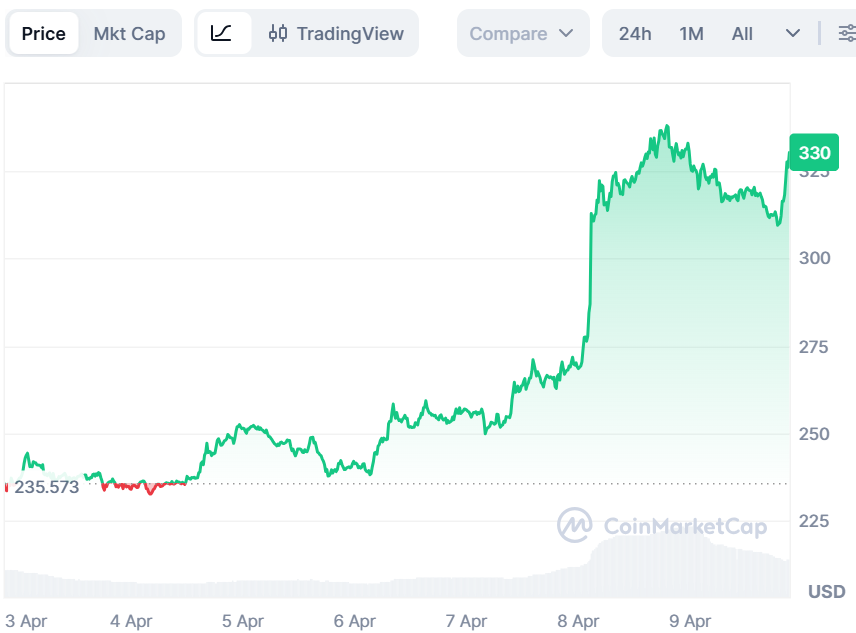
Source: CoinMarketCap

Also Read: Zcash (ZEC) Price Outlook: Will Strong Volume Drive Price Toward $392?
ZEC Breakout Signals Possible Rally Toward $440
Furthermore, the crypto analyst Ali Charts pointed out that Zcash is showing early signs of a breakout from a descending triangle pattern on its price chart.
This formation typically reflects declining volatility and pressure between lower highs and strong support. Recent trading suggests buyers are gaining control, pushing price toward the upper resistance trendline with growing momentum in recent sessions.
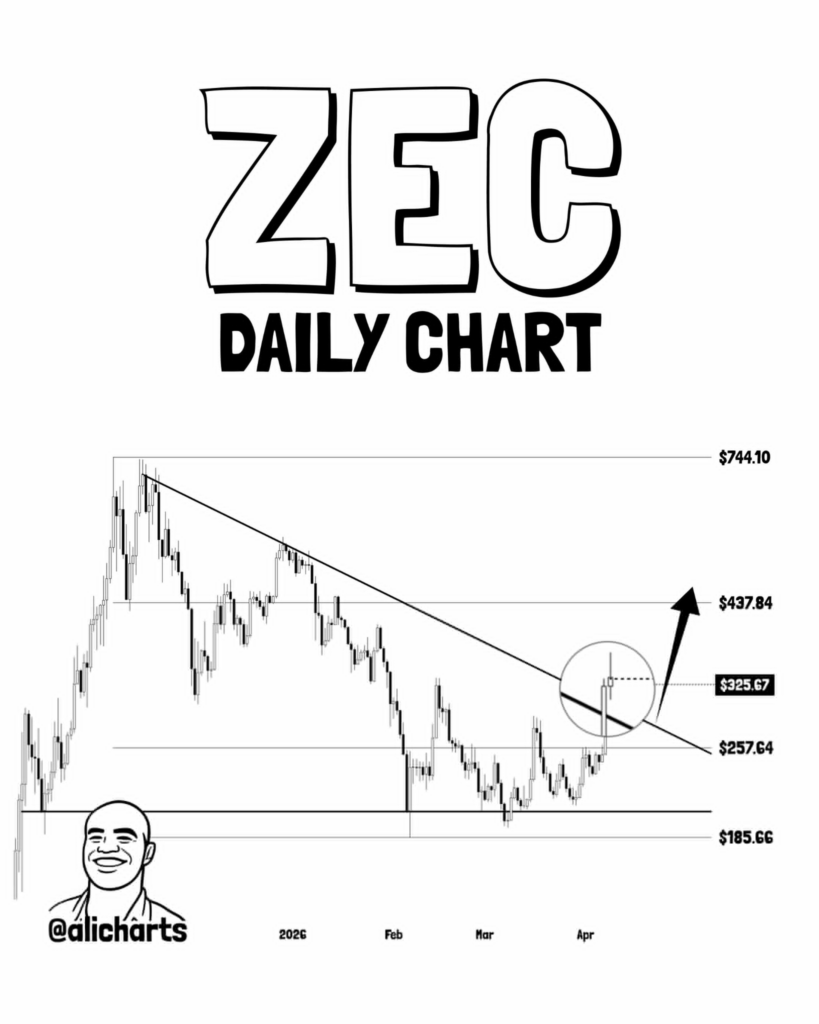
Source: Ali Charts’ X Post
If a breakout is confirmed, analysts suggest a measured move toward $440, based on classical triangle height projections used in technical analysis.
However, traders caution that false breakouts are common in volatile crypto markets without strong volume support. Rejection at resistance could trigger consolidation or retest lower support zones again in the short term this week.
Momentum Indicators Support the Ongoing Recovery
According to TradingView, the current value of the RSI of ZEC is 72.63, indicating that ZEC has become an overbought security.
The sharp rise beyond the 70 mark indicates high buying interest and an almost vertical movement in the asset’s price. Though momentum is high at this point, the high value may precede a pullback or consolidation period.
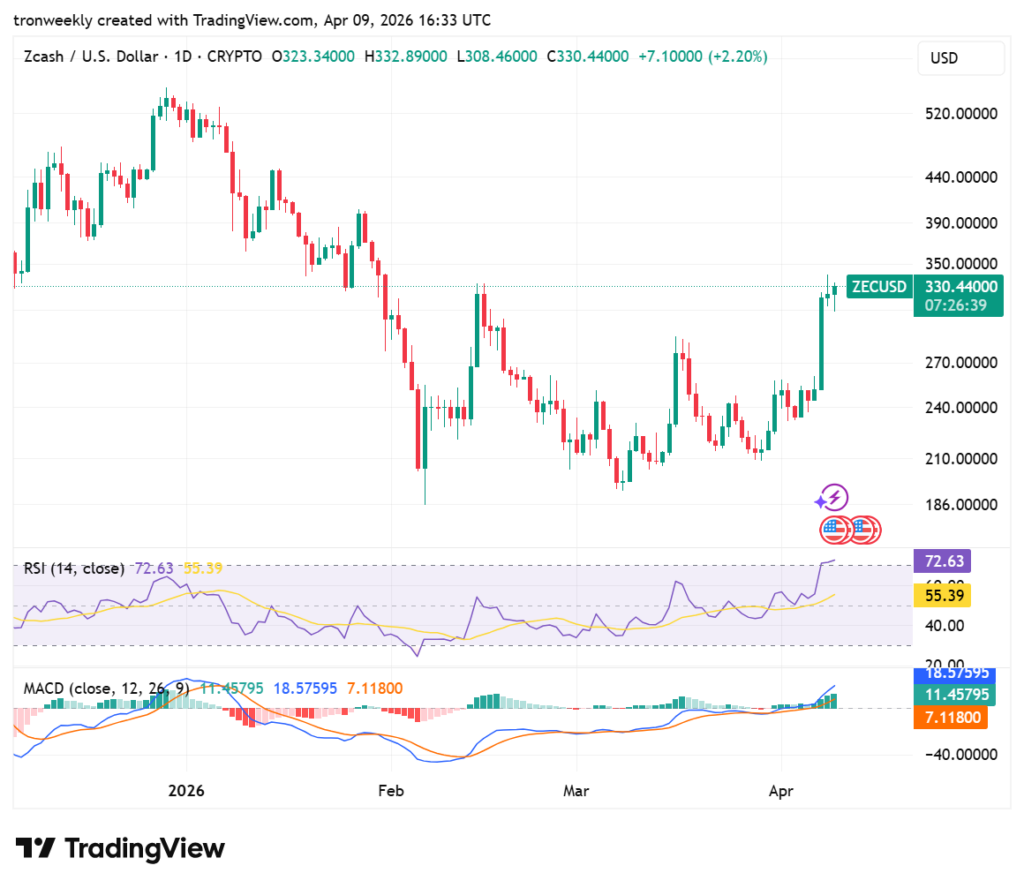
Source: TradingView
The MACD indicator also confirms this optimism, with the blue line increasing sharply to 18.57, crossing above the signal line. The growing gap between the two lines is further confirmed by the growing green bars of the histogram.
Yet the indicator is at multi-month highs, which indicates that while the uptrend is prevalent, it is becoming too fast.
This article contains market analysis and price predictions. These are not guarantees. Crypto markets are volatile. Always DYOR. Not financial advice.
Also Read: Zcash (ZEC) Bullish Setup Points to Potential Breakout Toward $750

Be the first to comment