


XRP is about to enter a phase known as extreme volatility compression, which traders frequently consider more hazardous than direct selling pressure.
The asset has stopped making significant directional movements and entered a tight consolidation range after losing the crucial $1.32 support level and collapsing toward the $1.10 region. On the surface, that might seem stable, but history indicates that these times are rarely long-lasting.
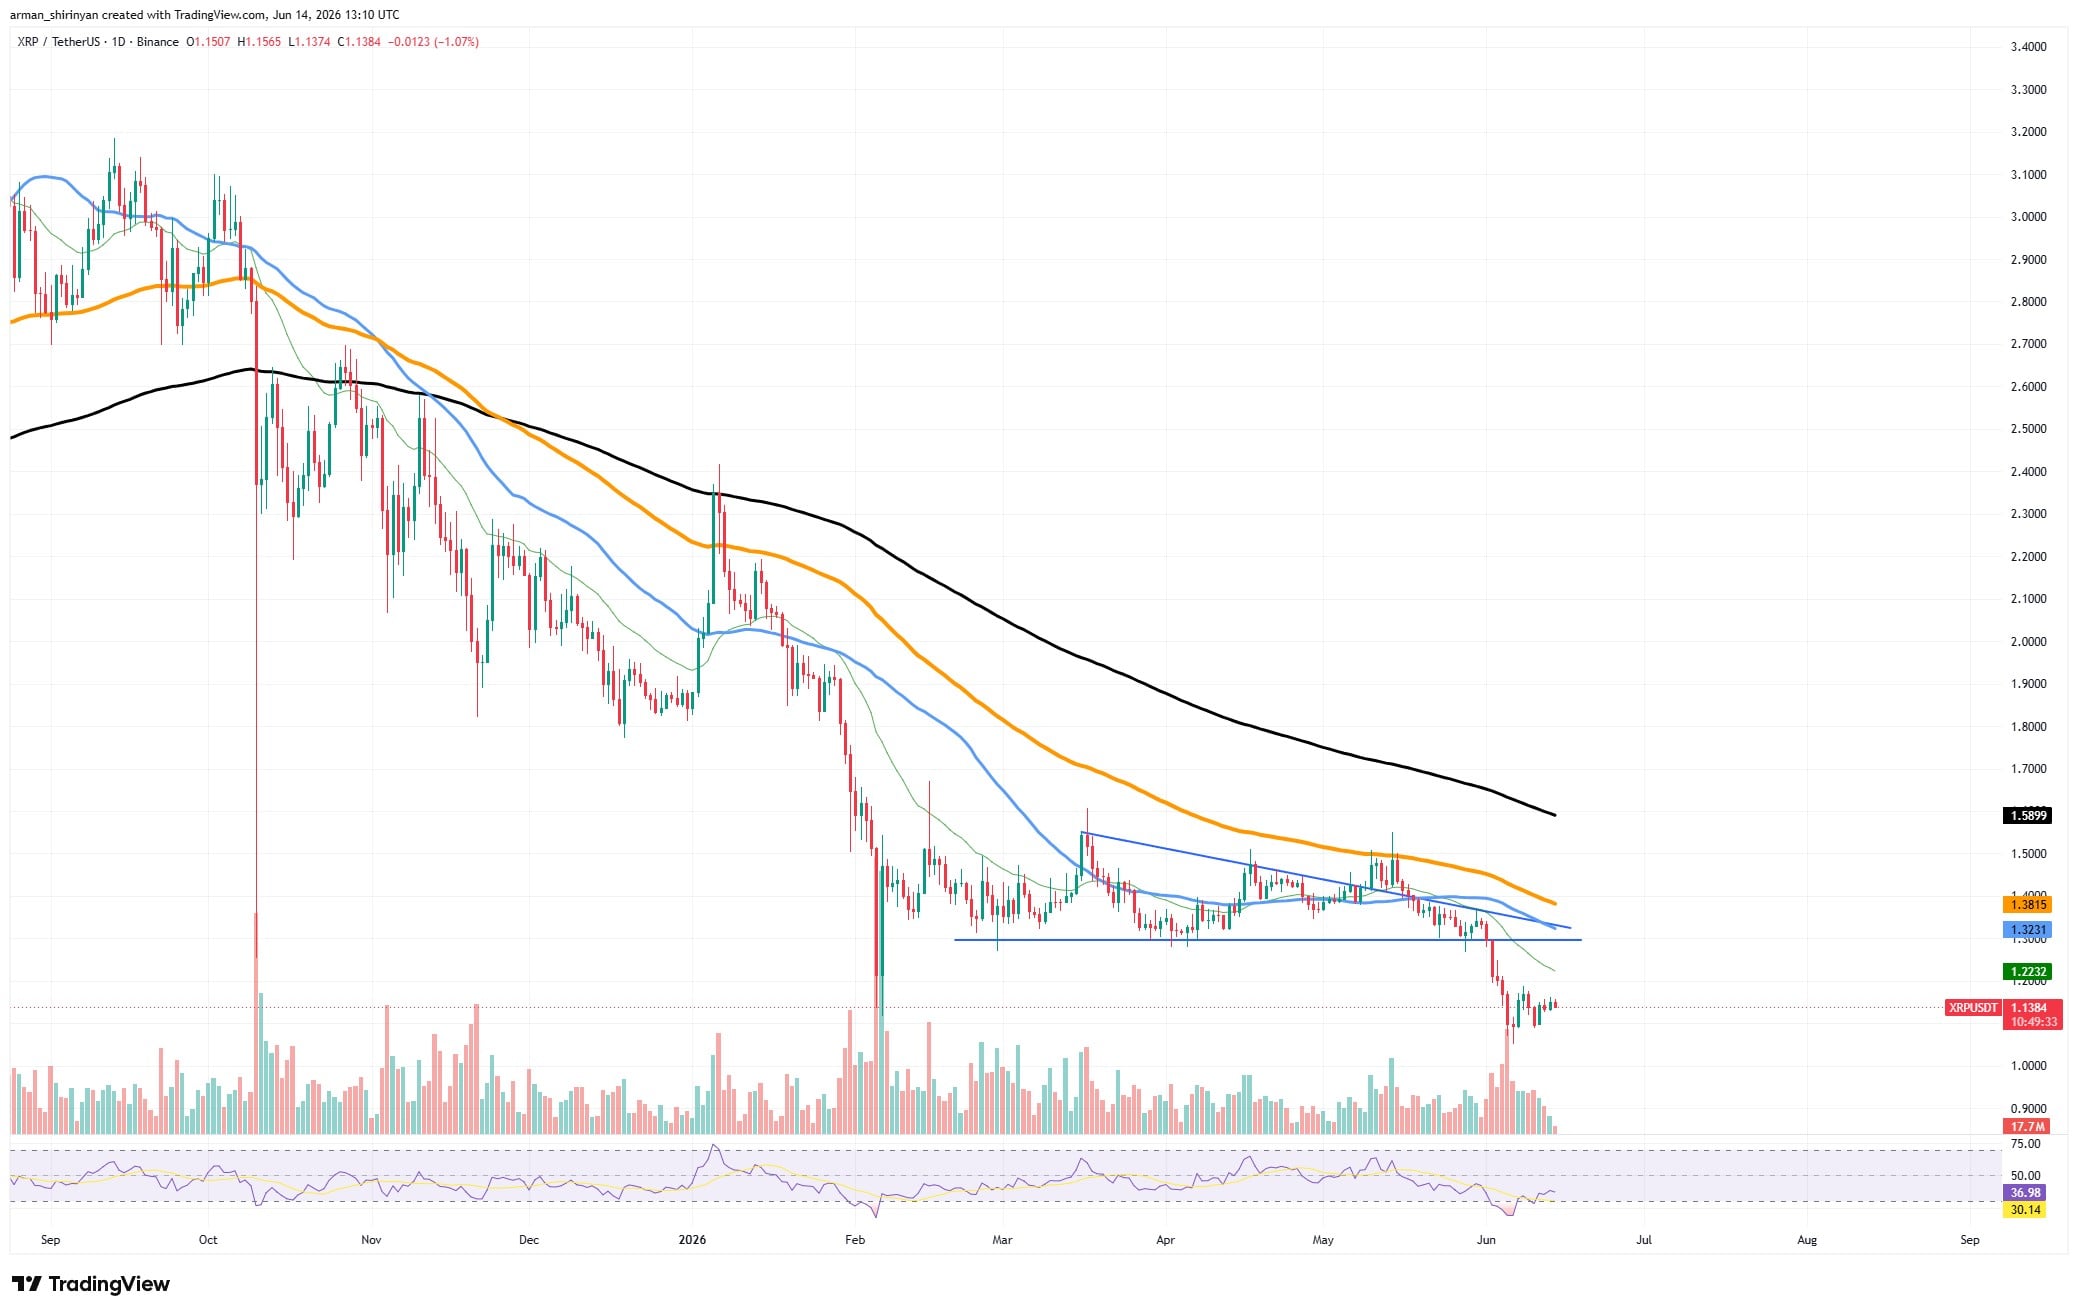
The daily chart displays XRP trading close to $1.14 following a dramatic break from a months-long descending triangle pattern. The asset fell well below its major moving averages due to the breakdown, which also caused a spike in volume.

However, volatility has quickly decreased since then. Volume has decreased in comparison to the capitulation spike, daily candles have shrunk significantly, and price action has narrowed into a small range. This combination usually indicates that buyers and sellers are temporarily worn out.
The issue is that volatility expansion typically comes after volatility compression. Put another way, the more stable XRP gets, the more probable it is that a significant move is in the works.
You Might Also Like
As of right now, XRP is still below the downward-sloping 50-, 100-, and 200-day moving averages. Therefore, bears are still favored by the technical framework. The 100-day moving average near $1.38 adds another barrier overhead, and the former support zone around $1.32 has now developed into a significant resistance level.
The current low of $1.08 is still the crucial level to keep an eye on on the downside. Another wave of liquidations might occur if sellers push XRP below that support and volatility resumes. On the other hand, after weeks of consistent weakness, a breakout above $1.22 would be the first sign that buyers are taking back control.
Due to the lack of conviction on both sides of the market, the RSI has recovered from oversold territory and is currently in neutral conditions. This neutrality strengthens the notion that XRP is awaiting a catalyst.
Extremely low volatility periods frequently give people a false sense of security. The present calm should not be interpreted as stability for XRP. The market is coiling following a significant breakdown, and the likelihood that the next move will be aggressive increases with the length of time volatility is suppressed.
Cardano pushed to the limit
Following a violent selloff that drove the asset below a crucial support zone that had been in place since February, Cardano has entered one of its most oversold conditions in months.
Investors are wondering if the market has finally reached a bottom, as ADA is currently trading close to $0.17 after losing nearly 30% of its value in just a few days.
It’s still a difficult technical picture. The long-standing support level at $0.24, which had repeatedly stopped deeper declines throughout the spring, was recently breached by ADA. Selling pressure quickly increased after that support failed, setting off a chain reaction of liquidations and panic exits.
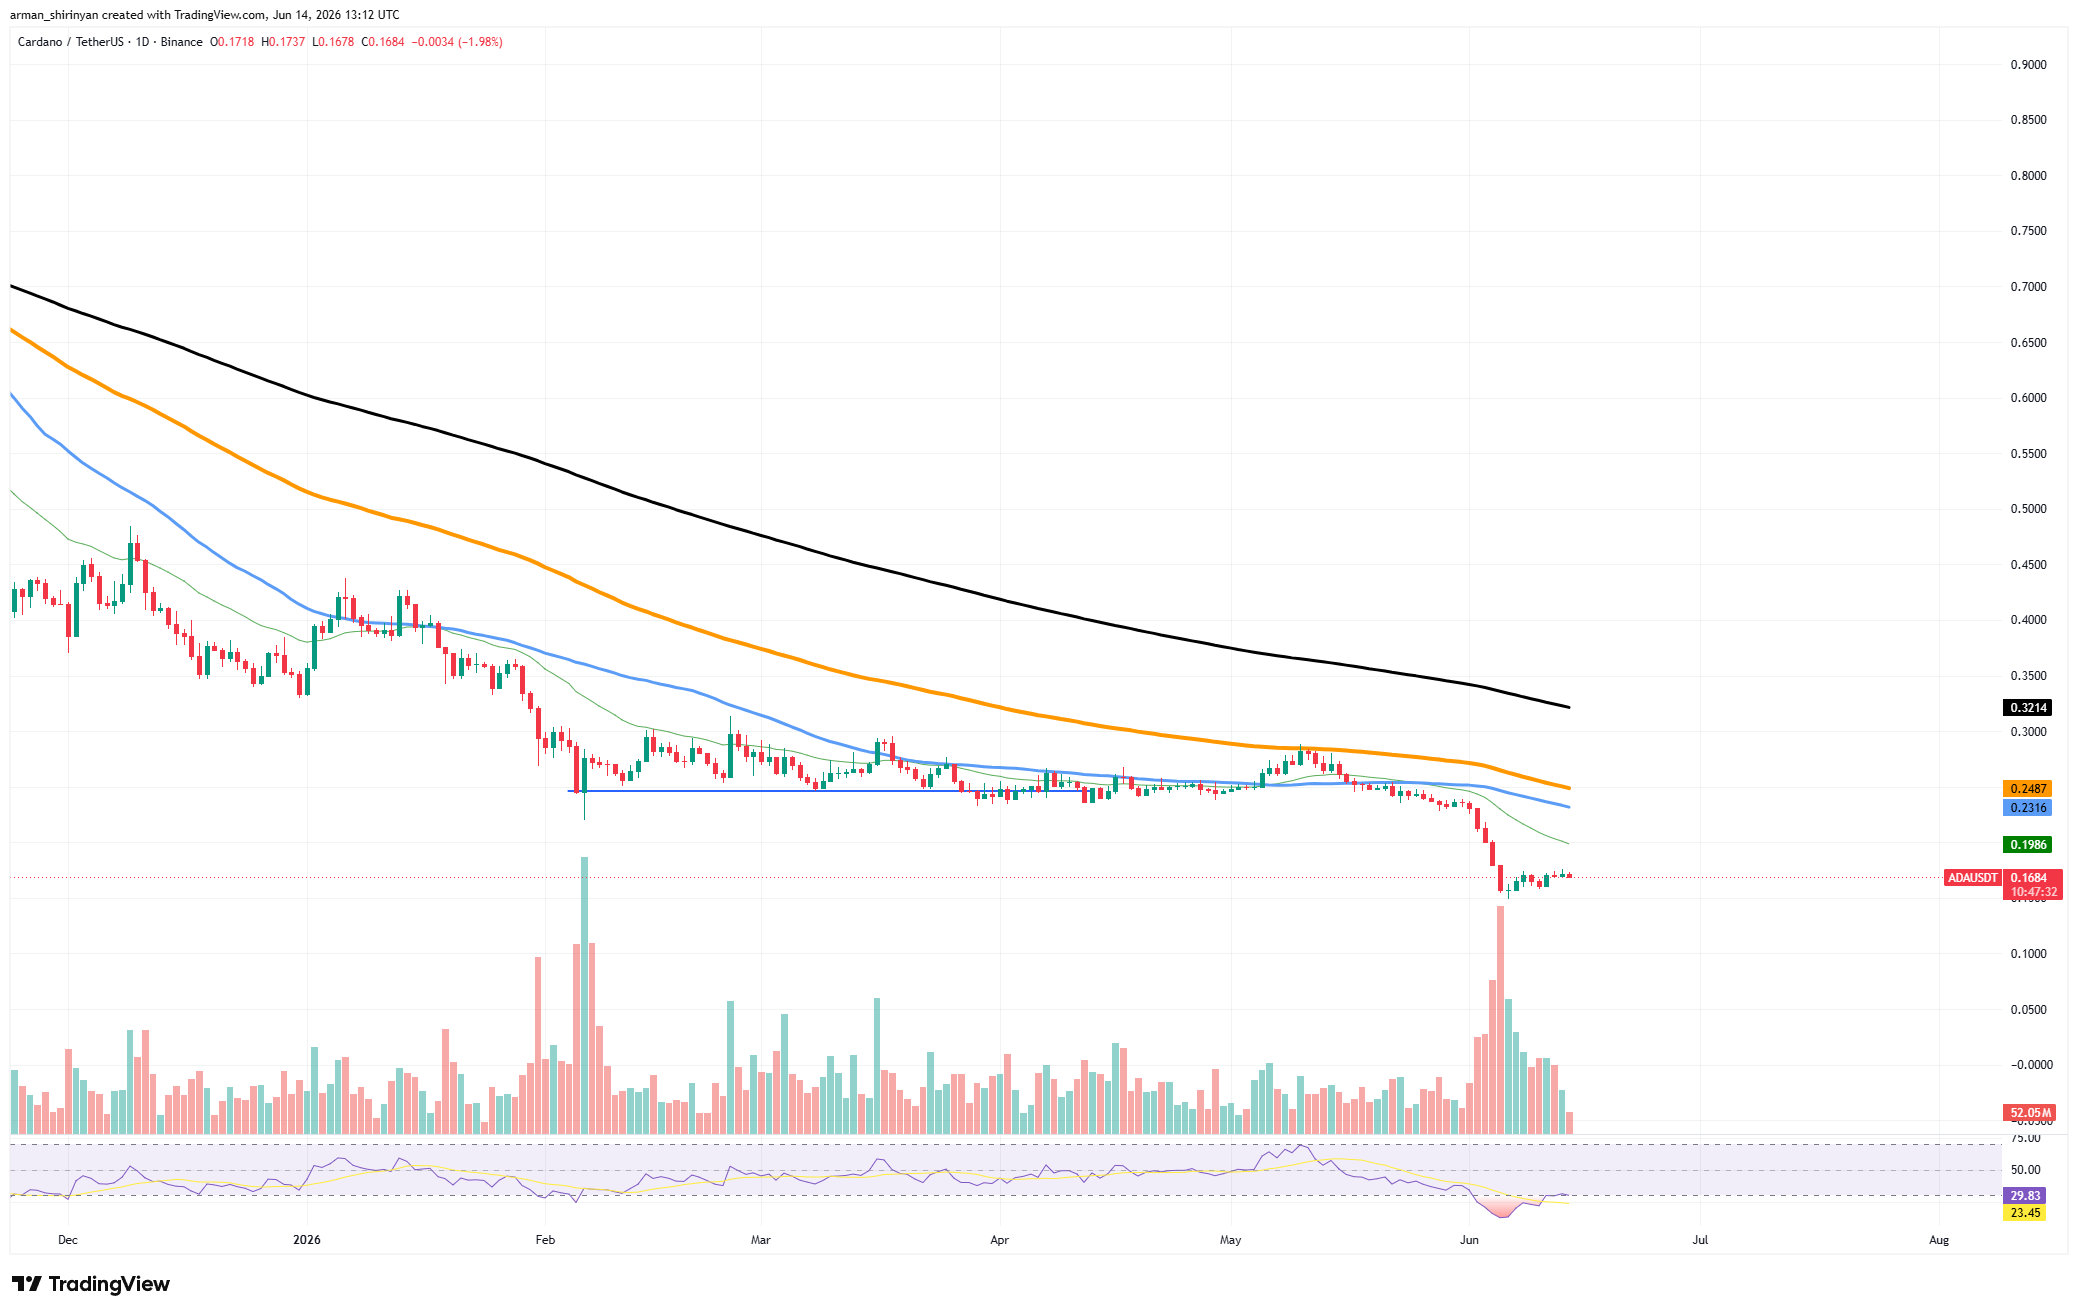
As a result, there was a sharp decline and a notable increase in trading volume, which is frequently an indication of capitulation.
It’s interesting to note that the Relative Strength Index is now extremely oversold. In the past, Cardano seldom stays at such low momentum readings for long. Oversold conditions frequently precede at least a brief relief rally, as sellers start to exhaust themselves, even though they do not by themselves guarantee a reversal.
Stabilization above the recent low around $0.15 would be the first sign that ADA has found recovery ground. Thus far, there has been a slight recovery, as buyers have intervened in that area.
You Might Also Like

The question of whether that bounce can turn into a long-term recovery or just turn into another dead-cat bounce within a broader downtrend is now a crucial test for the market.
The first resistance is located around $0.20, close to the 50-day moving average, should buyers gain momentum. After that, ADA encounters a much bigger obstacle between $0.23 and $0.25, where the previous support area now becomes resistance.
Regaining that area would significantly improve the situation and imply that the recent breakdown was an overreaction rather than the beginning of yet another significant decline.
But bears are still in charge for the time being. The fact that ADA is still trading below its 50-, 100-, and 200-day moving averages indicates that the overall trend is still strongly negative.
XRP’s fuel decreases
XRP is about to enter a phase of solid volatility compression, which traders frequently consider more hazardous than direct selling pressure.
The asset has stopped making significant directional movements and entered a tight consolidation range after losing the crucial $1.32 support level and collapsing toward the $1.10 region. On the surface, that might seem stable, but history indicates that these times are rarely long-lasting.
You Might Also Like

The daily chart displays XRP trading close to $1.14 following a dramatic break from a months-long descending triangle pattern. The asset fell well below its major moving averages due to the breakdown, which also caused a spike in volume.
However, volatility has quickly decreased since then. Volume has decreased in comparison to the capitulation spike, daily candles have shrunk significantly, and price action has narrowed into a small range. This combination usually indicates that buyers and sellers are temporarily worn out.
The issue is that volatility expansion typically comes after volatility compression. Put another way, the more stable XRP gets, the more probable it is that a significant move is in the works.
You Might Also Like

As of right now, XRP is still below the downward-sloping 50-, 100-, and 200-day moving averages. Therefore, bears are still favored by the technical framework. The 100-day moving average near $1.38 adds another barrier overhead, and the former support zone around $1.32 has now developed into a significant resistance level.
The current low of $1.08 is still the crucial level to keep an eye on on the downside. Another wave of liquidations might occur if sellers push XRP below that support and volatility resumes. On the other hand, after weeks of consistent weakness, a breakout above $1.22 would be the first sign that buyers are taking back control.
Due to the lack of conviction on both sides of the market, the RSI has recovered from oversold territory and is currently in neutral conditions. This neutrality strengthens the notion that XRP is awaiting a catalyst.
Extremely low volatility periods frequently give people a false sense of security. The calm should not be interpreted as stability for XRP. The market is coiling following a significant breakdown, and the likelihood that the next move will be aggressive increases with the length of time volatility is suppressed.

Be the first to comment