


What to know:
- Zcash (ZEC) maintains a broader uptrend despite short-term correction, holding key support near $230–$235
- Weak momentum and falling moving averages signal selling pressure, with risk of drop toward $220
- Symmetrical pattern suggests breakout potential, with $245–$250 acting as key upside trigger


Zcash (ZEC) is showing a mixed market structure as recent price action reflects both strength and hesitation. After a strong rally earlier in March, the asset is now moving through a corrective phase, with traders closely watching key levels for the next move.
Market participants are adjusting their outlook as structure evolves and momentum shifts across different timeframes.

Also Read: Zcash Explodes Past $280: $400 Could Be Next Milestone
Bullish Structure Holds Despite Short-Term Weakness For Zcash
According to GM_Crypto X post, Zcash continues to ride the overall uptrend that began back in March, even while the price corrects. The proposed buying range is between $232 and $235.
The proposed targets are $245, $255, and $270. The stop loss is proposed to be set at $228. This is a clear expression of confidence that the major trend will continue as long as the price remains above the key support.
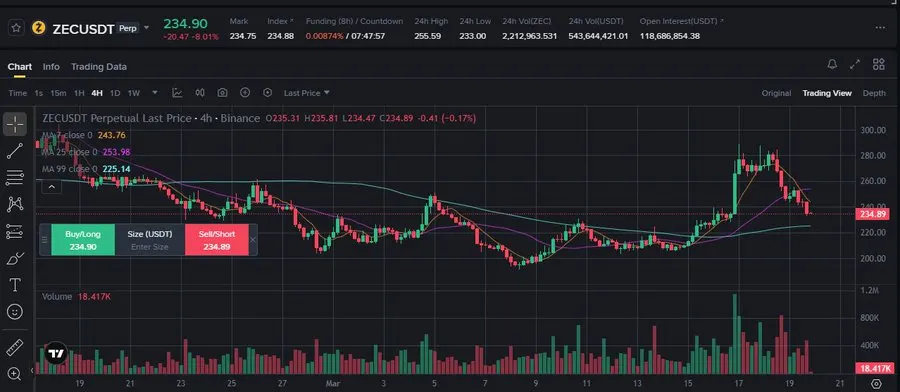
Recently, ZEC has moved out of its long-term range of small price movements as its momentum remained low and its highs continued to fall.
The strong buying of ZEC pushed the price up to the $280 to $290 price range. The price was rejected at $280, and this led to selling and profit-taking.

Source: X
As we can see, the momentum is decreasing on the 4-hour chart. The short-term moving averages, or 7 and 25 MA, have started to fall.
This indicates selling pressure dominating the market. However, the price is currently testing the 99 MA, which is around $225 to $230.
This is a support level and is vital for the overall uptrend. The volume is decreasing during the minor price movements, suggesting there is no strong buying pressure.
From a price action perspective, the $230 to $235 price range is a critical horizontal support. If this price fails, it could accelerate the downside pressure, which could potentially take prices lower, possibly to $220 or even lower.
Conversely, if prices bounce above $245 to $250, it could be a sign of strength and potentially test the higher resistance levels once again.
Market Structure Shifts Signal Possible Breakout
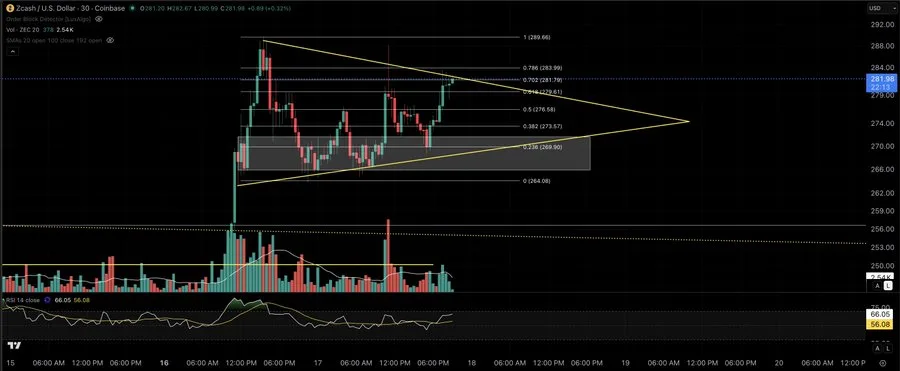
Analyst Eric Van Tassel points out that there is a notable shift in the pattern. The descending triangle is no longer there; it is replaced by a symmetrical compression pattern.
This is an indicator that the market is no longer trending in one direction and may be preparing for a breakout.

Source: X
Price is having difficulty at the 0.702 Fibonacci level. The level is also the top of the current pattern. The levels align and make it a crucial point for traders to make decisions.
This article contains market analysis and price predictions. These are not guarantees. Crypto markets are volatile. Always DYOR. Not financial advice.
Also Read: Zcash (ZEC) 17% Surge Despite Bearish Market Signals

Be the first to comment