


What to know:
- Litecoin continues consolidating in a tight range, showing balanced buying and selling pressure with low volatility.
- Price hovers around the mid-$55 level with a slight 24-hour decline, reflecting weak market conviction.
- Analysts compare the current accumulation phase to XRP’s pre-breakout structure, hinting at possible future volatility expansion.

Litecoin (LTC) has moved within a tight range since there is no definitive trend in the market, implying a balance between buyers and sellers. This indicates a lack of decision in the market, but technical conditions imply that a bigger move might happen.
At the time of writing, Litecoin (LTC) is trading at $55.26, supported by a 24-hour trading volume of approximately $393.26 million and a market capitalization close to $4.27 billion, according to CoinMarketCap data. The LTC has recorded a slight decline of around 0.14% over the last 24 hours, reinforcing the ongoing lack of strong market conviction.

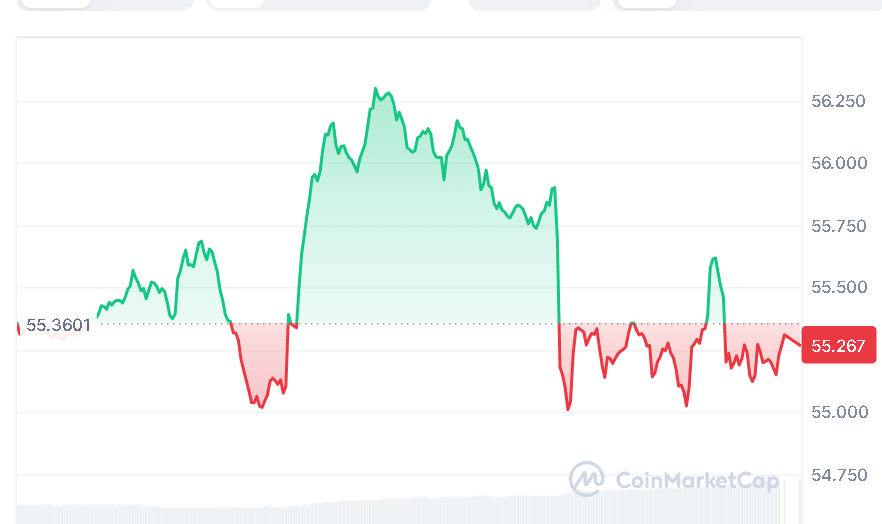
Source: CoinMarketCap

Also Read | XRP Forms Diamond Setup as Analysts Watch $1.50 Breakout Level
Litecoin Range Mirrors XRP Pattern
On May 4, 2026, crypto analyst Crypto Patel shared an analysis comparing Litecoin’s movement in the $40–$50 range with XRP’s accumulation phase before its significant breakout. He suggested that reduced public interest combined with quiet accumulation may serve as potential indicators of upcoming volatility expansion.

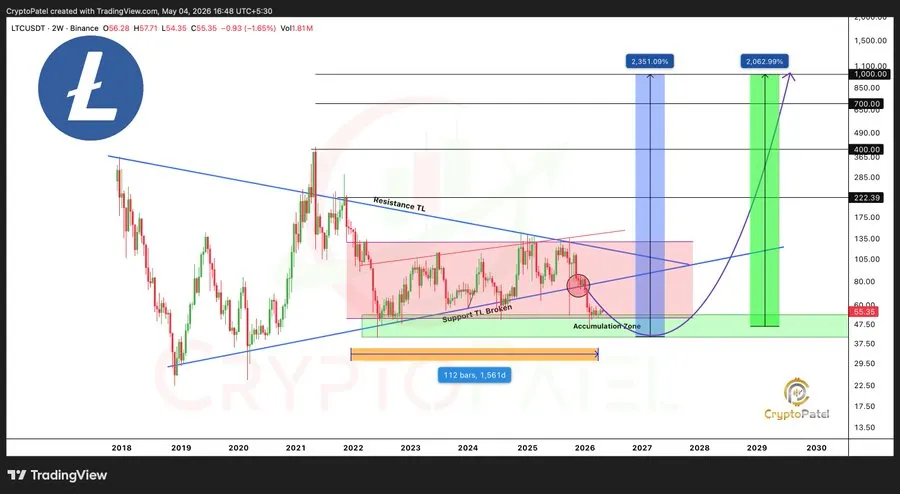
Source: Crypto Patel’s X Post
Crypto Patel also provided long-term price speculations for crypto that ranged between $500 and $1,000; nonetheless, these forecasts are highly speculative and hinge on substantial changes in the macro environment and the market.
Litecoin Technicals Show Weak Direction
Technically speaking, Litecoin remains range-bound as prices have been consolidating within the confines of its moving average cluster. Its 20-day SMA is currently trading at $55.60, while its 50-day SMA is trading at $55.06, reflecting an evenly balanced short-term condition.
Meanwhile, its 100-day and 200-day SMAs remain intact at $55.72 and $70.33, respectively, putting further resistance pressure on any potential upward breakout.
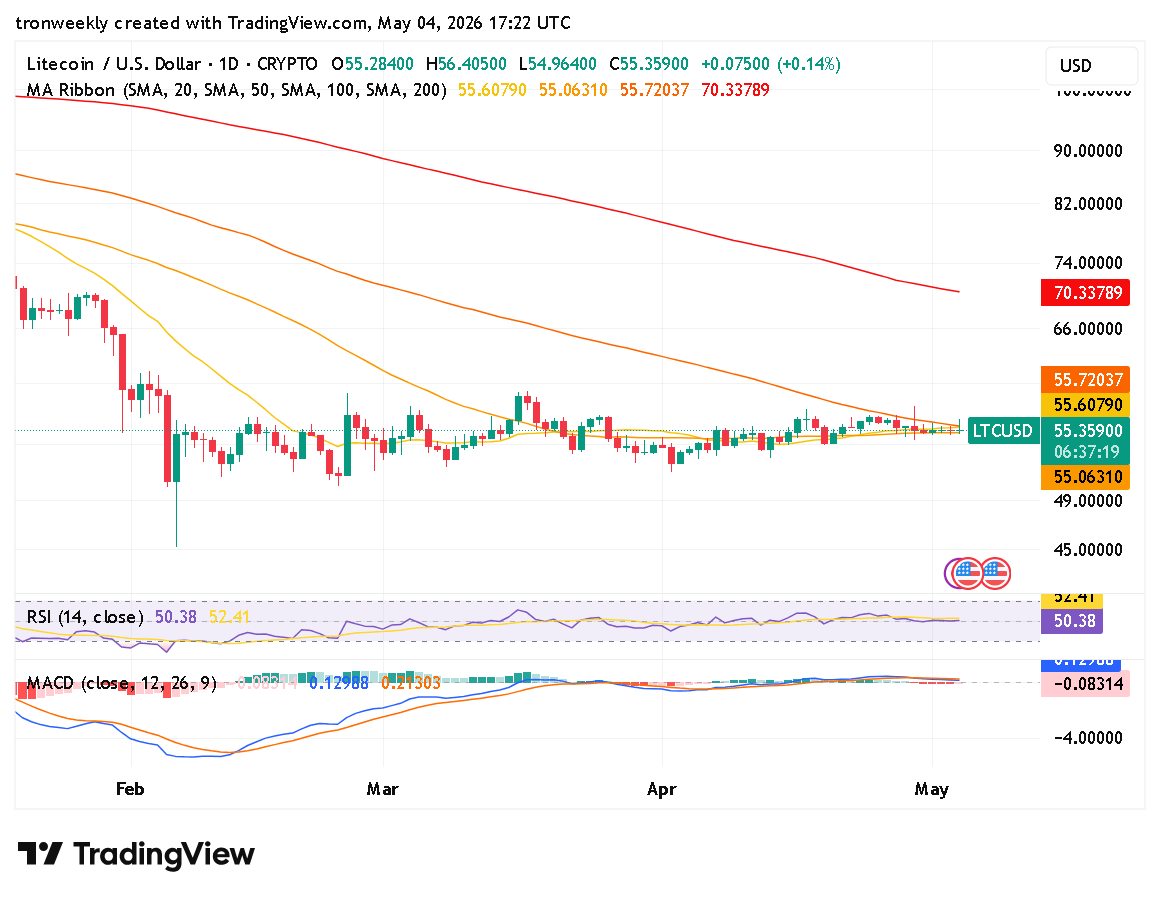

Source: TradingView
Momentum indicators also show an equilibrium situation and not a strong trend. The RSI is trading close to 50.38, with an average of 52.41, implying that buyers and sellers do not have any control over market movements. Moreover, the MACD indicator is weak, as the histogram shows no bullish momentum.
However, from a technical point of view, Litecoin has remained in a range-bound period with low volatility without any breakout pattern emerging. As long as there is no compelling reason or resistance break, the asset can continue trading in a sideways trend for some time to come.
This article contains market analysis and price predictions. These are not guarantees. Crypto markets are volatile. Always DYOR. Not financial advice.
Also Read | SUI Price Outlook: Key Support Holds as Bulls Eye $1.50 and $2.30 Targets

Be the first to comment