



Here is a technical analysis of ETH/USDT on the daily timeframe:
Market Overview
Ethereum has strengthened its technical structure over the past week by delivering a confirmed breakout above the $1,850 resistance level, which had repeatedly capped price action throughout July. Last week’s report highlighted this resistance as the key level to watch, and the subsequent breakout, followed by a successful retest, has shifted the short-term bias in favour of the bulls. ETH is currently trading around $1,918, with the price holding comfortably above the breakout zone, indicating that buyers continue to defend higher levels.
Technical Analysis
The breakout above $1,850 was technically significant, as it invalidated the previous consolidation range and established a new higher high. Following the breakout, Ethereum retraced briefly to test the former resistance, which held as support before buyers stepped back in. This breakout-retest sequence is generally considered a strong continuation signal.
The daily structure continues to show higher highs and higher lows, confirming that the short-term trend remains bullish. Momentum has also improved, with no signs of aggressive selling pressure or bearish reversal patterns visible on the daily chart. The price is now approaching the important $2,000 psychological resistance level, which is expected to be the next major test for buyers. This level may attract short-term profit booking, but unless sellers regain control below $1,850, the broader structure remains constructive.

Also Read: What is ATH (All-Time High) in Crypto? Difference between ATH & ATL
The current technical setup slightly favours a bullish continuation. If Ethereum sustains above $1,850 and buying volume increases near $2,000, a breakout above this psychological resistance could extend the rally towards $2,150–$2,200.Alternatively, if buyers struggle to clear $2,000, the market may enter a period of consolidation between $1,850 and $2,000. Such price action would be considered healthy and could build the momentum required for a later breakout. The bullish outlook would only weaken if ETH closes back below $1,850, which could trigger a corrective move towards the $1,750 support zone.
At the time of writing, ETH was trading at approximately $1,918.
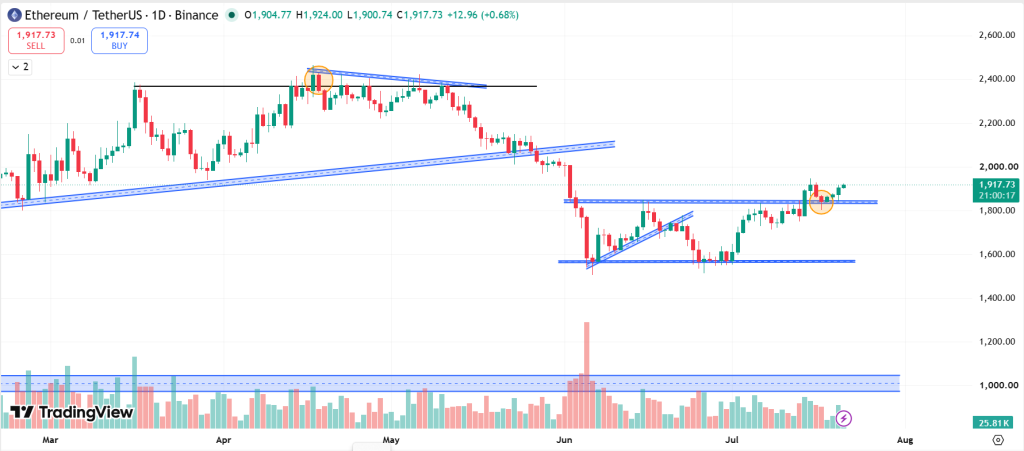
Summary: Ethereum has confirmed a bullish breakout from last week’s consolidation range, successfully converting $1,850 from resistance into support. The overall market structure remains positive, with momentum favouring buyers as the price approaches the next key resistance at $2,000. While short-term consolidation remains possible near this level, the current chart continues to favour an upside breakout unless the price falls back below the newly established support.
Support and Resistance Levels
| Support 2 | Support 1 | Asset | Resistance 1 | Resistance 2 |
| $1,750 | $1,850 | ETH | $2,000 | $2,200 |
In the grand scheme of things, ZebPay blogs are here to provide you with crypto wisdom. Get started today and join 6 million+ registered users to explore endless features on ZebPay!
Disclaimer:
Crypto products and NFTs are unregulated and can be highly risky. There may be no regulatory recourse for any loss from such transactions. Each investor must do his/her own research or seek independent advice if necessary before initiating any transactions in crypto products and NFTs. The views, thoughts, and opinions expressed in the article belong solely to the author, and not to ZebPay or the author’s employer or other groups or individuals. ZebPay shall not be held liable for any acts or omissions, or losses incurred by the investors. ZebPay has not received any compensation in cash or kind for the above article and the article is provided “as is”, with no guarantee of completeness, accuracy, timeliness or of the results obtained from the use of this information.


Be the first to comment