



The total crypto market cap has shrunk by 1.18% in the past 24 hours. The Crypto Market Fear and Greed Index sat at a score of 34, signaling fear was still prevalent in the market.
AMBCrypto reported that Bitcoin [BTC] saw its longest streak of spot ETF inflows in nine months. It pointed to increased demand and a potential shift in sentiment, but the streak was broken.
SoSoValue, the cryptocurrency research platform that aggregates macro market data, reported -$225.1 million in spot ETF net flows on Thursday, July 23.
The escalation in U.S.-Iran tensions and higher Brent crude prices coincided with the reversal in ETF flows, adding to the broader risk-off mood across markets.

Bitcoin was down 1.35%, and Ethereum down 1.85%. TOTAL3, which tracks the altcoin market cap excluding ETH, has fallen 1.17% in 24 hours.
Some BTC treasury firms were abandoning their accumulation model and actively looking to liquidate and completely exit crypto treasury strategies.
Liquidations and trend shift help explain why crypto is down today
On July 19 and 20, short liquidations dominated crypto markets, measuring $305.68 million. By comparison, only $164.04 million in long liquidations occurred to start the week.
Since then, $489.268 million in long liquidations have occurred, as opposed to $205.13 million in short liquidations. In other words, traders who bet on continued upward momentum were being forced out of the market.
AMBCrypto had reported that the price bounce in recent days was accompanied by a lack of significant participation from new capital. Short-term holders continued to realize losses, and bears were still in control of the market’s direction.
Where Bitcoin goes, the rest of crypto tends to follow. Right now, that direction is southward.
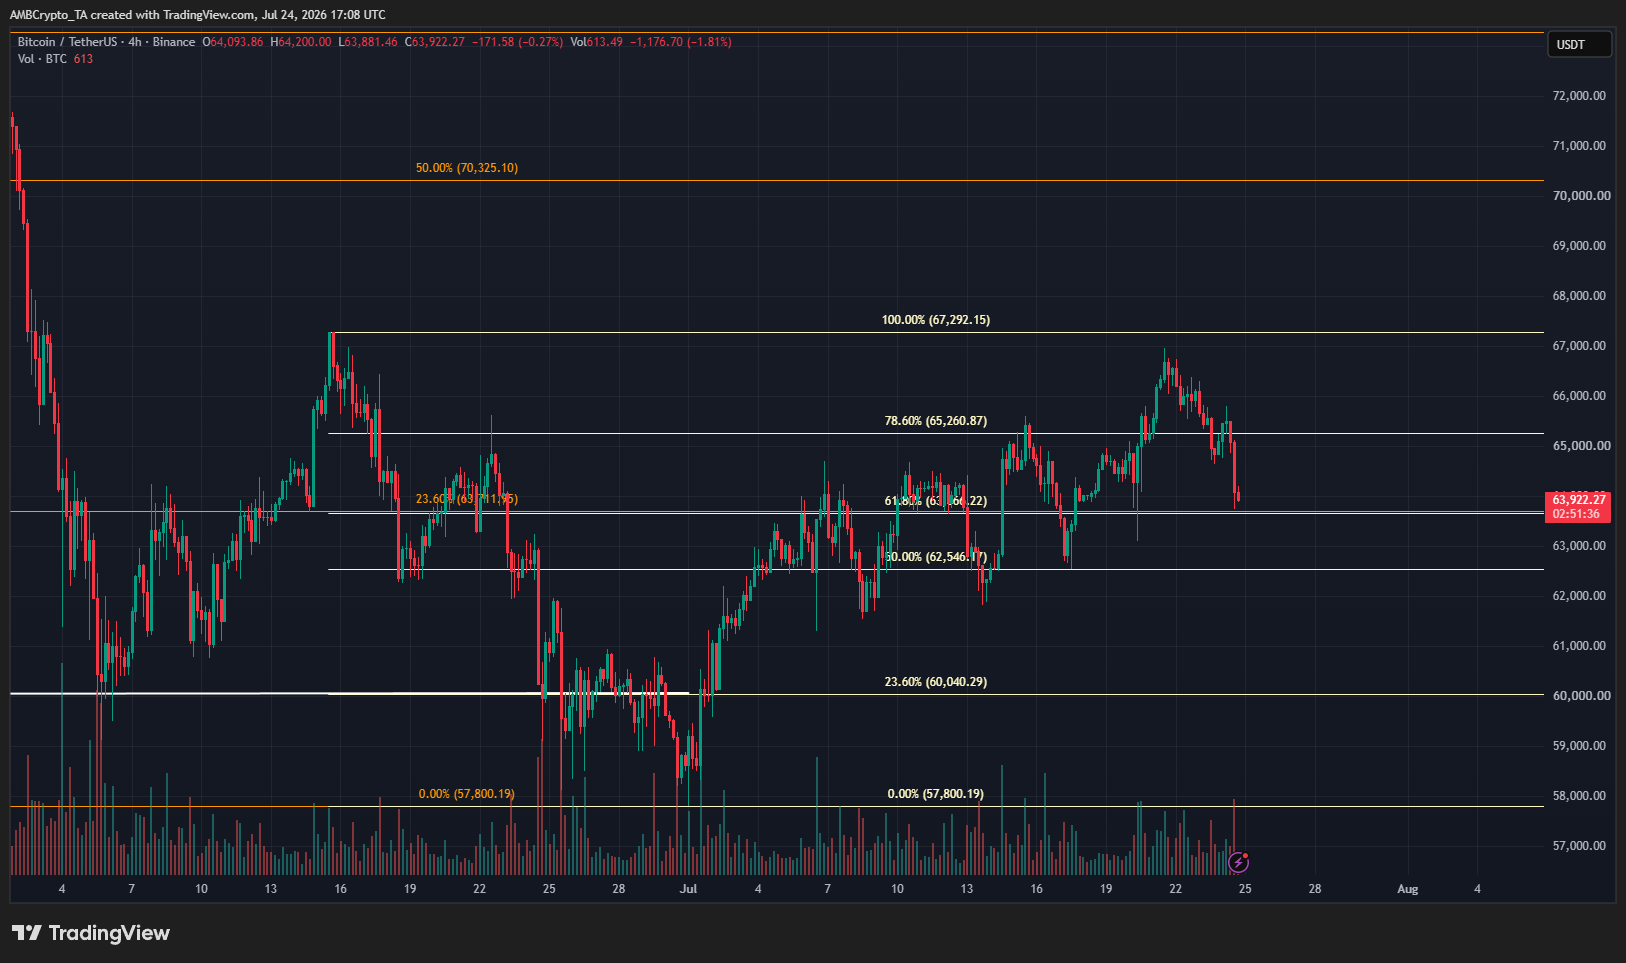
The higher timeframe price trend has been bearish since October 2025. The 4-hour chart was also bearish. The $67,292 swing high must be breached to flip this structure bullishly.
The bulls tried and failed to challenge the $67k resistance zone convincingly. The recent downturn is a result of buyer exhaustion and the prevalent bearish price structure.
If the current trend continues, the next impulse move downward could open the door to a retest of the $57,800 area if sellers remain in control.
Final Summary
- The crypto market saw a steady advance higher earlier this week, helped by bullish spot ETF flows and BTC momentum.
- This has taken an abrupt shift just as Bitcoin and Ethereum ran into key resistance zones at $67k and $1,920 respectively. Further downside is expected.






Be the first to comment