



Bitcoin (BTC), Ethereum (ETH), and XRP ended July on a cautious note after facing renewed selling pressure near key resistance levels. While the broader market remains in a recovery phase following June’s correction, all three cryptocurrencies have entered August trading within critical technical structures that could determine their next directional move.
Will Bitcoin reclaim its descending trendline and revive bullish momentum? Can Ethereum defend its ascending trendline and extend its recovery? And will XRP finally break out of its multi-week descending channel? Here’s a closer look at the technical outlook for BTC, ETH, and XRP heading into August 2026.
Bitcoin (BTC) Price Analysis for August 2026
Bitcoin price is trading around $62,865 after facing rejection near the upper boundary of its descending channel. The recent pullback has pushed the price below the 20-day moving average, while the longer-term moving averages continue to slope downward, suggesting the broader trend remains under pressure.
The Relative Strength Index (RSI) has slipped below the neutral 50 level to around 44, indicating weakening bullish momentum. Although the indicator remains well above oversold territory, buyers will need to regain control quickly to prevent further downside.


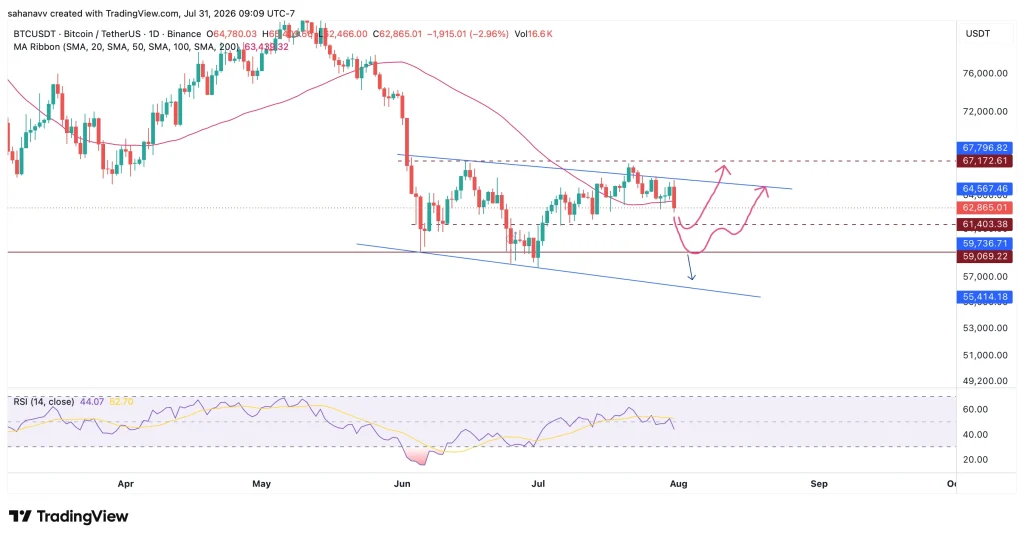
From a technical perspective, $61,400 serves as the immediate support, followed by the major support near $59,070. A break below this region could expose Bitcoin to the channel’s lower boundary around $55,400.
On the upside, bulls must reclaim the descending trendline before attempting to challenge the resistance at $64,567. A sustained move above this level could pave the way for a retest of $67,172, where sellers are expected to re-emerge.
Ethereum (ETH) Price Analysis for August 2026
Ethereum is trading near $1,865 after failing to sustain gains above the rising trendline that supported its July recovery. The latest rejection suggests buyers are losing momentum as ETH price approaches a key decision zone.
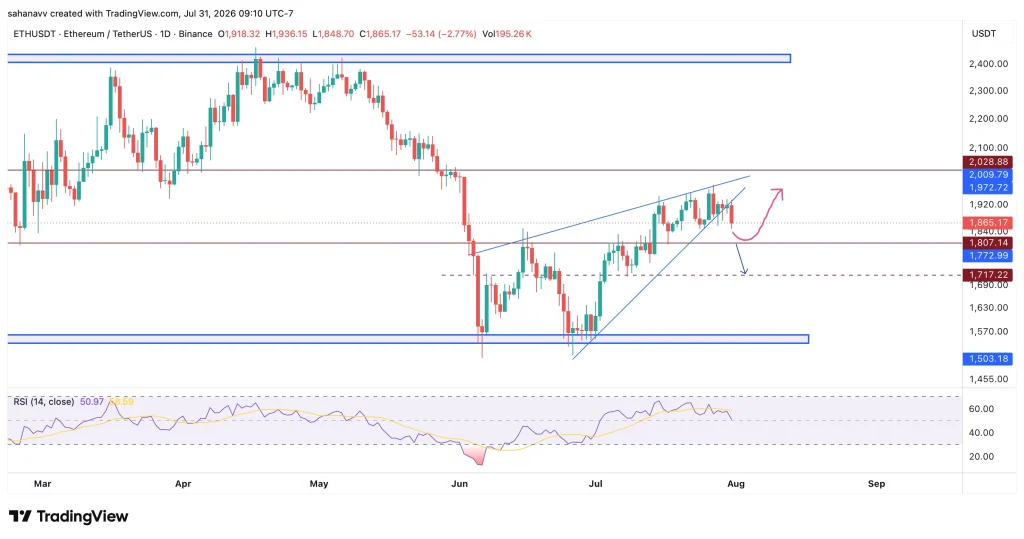
The RSI remains close to the neutral level around 51, indicating a balance between buying and selling pressure. This suggests Ethereum is yet to establish a clear trend heading into August. Immediate support is located at $1,807, followed by $1,717 if bearish momentum strengthens. Losing these levels could expose ETH to the broader demand zone around $1,500.
On the bullish side, reclaiming the rising trendline could allow ETH to challenge the psychological $2,000 level, with $2,029 acting as the first major resistance. A successful breakout above this region could shift momentum toward the broader resistance zone near $2,400.
XRP Price Analysis for August 2026
XRP price is trading around $1.06, continuing to move within a descending channel that has contained price action since June. Despite several recovery attempts throughout July, buyers have repeatedly failed to break above the channel’s upper boundary, keeping the short-term trend bearish.
The RSI has slipped to around 41, reflecting weakening momentum and suggesting sellers continue to hold a slight advantage. However, the indicator remains above oversold levels, leaving room for another recovery attempt if support holds.
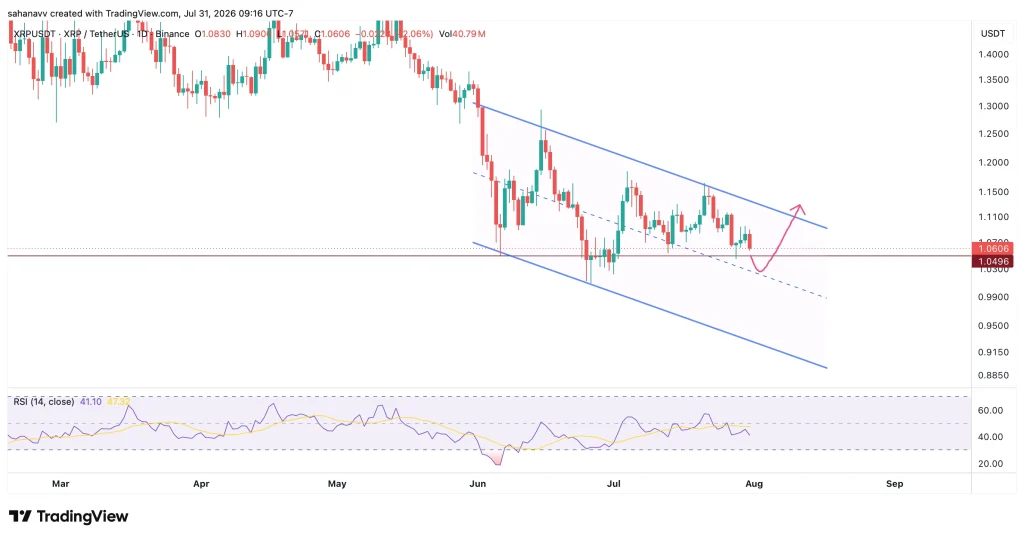
The immediate support lies near $1.05, with stronger support around the lower boundary of the descending channel. A decisive break below this region could accelerate losses toward the next major support area below the channel.
If buyers defend current levels, XRP could once again test the channel’s upper trendline. A breakout above this resistance would improve the short-term outlook and could open the door for a move toward $1.11, followed by higher resistance levels if bullish momentum strengthens.
The Bottom Line—Can the Bullish Momentum Prevail in August 2026?
Bitcoin, Ethereum, and XRP are entering August at critical technical levels after ending July with renewed selling pressure. While each asset remains within a broader recovery phase, none has yet confirmed a bullish breakout, leaving traders focused on nearby support and resistance levels for confirmation.
Among the three, Ethereum appears technically stronger as it continues to trade above key support despite recent weakness. Bitcoin remains trapped inside a descending channel, requiring a breakout above trendline resistance to regain bullish momentum, while XRP continues to consolidate within its own descending structure, making its next move highly dependent on whether buyers can reclaim the channel resistance.
As August begins, a decisive breakout above resistance could revive bullish sentiment across the crypto market. Conversely, losing key support levels may extend the recent correction before a stronger recovery can take shape.





Be the first to comment