



$XRP is trading at $1.0662 on the Bitstamp daily chart as of 3 August, down 1.75% on the session after opening at $1.0858 and printing a low of $1.0618. That is roughly 43% lower on the year and about 70% below last summer’s high near $3.65. Every conversation about buying XRP at these levels starts from the same place: the chart is cheap relative to 2025, and cheap relative to 2025 has been a losing argument for eight months straight.
So the question is not whether XRP looks discounted. It is whether the technical structure and the macro calendar give a buyer anything to work with. Here is what both are saying.
XRP Price Analysis: Good Technicals Shaping up
The single most important line on the chart is the 200-day EMA at $1.39699. Price is 31% below it, and the average itself is sloping down. That is the definition of an established downtrend, and it means every rally since June has been a rally inside a bear structure, not a recovery from one.
Below that, the levels stack up cleanly:

- Resistance: $1.15, then $1.20, then $1.30, with $1.45 and $1.50 marking the May breakdown zone
- Support: $1.00, the green line that has been tested repeatedly since late June and has not given way
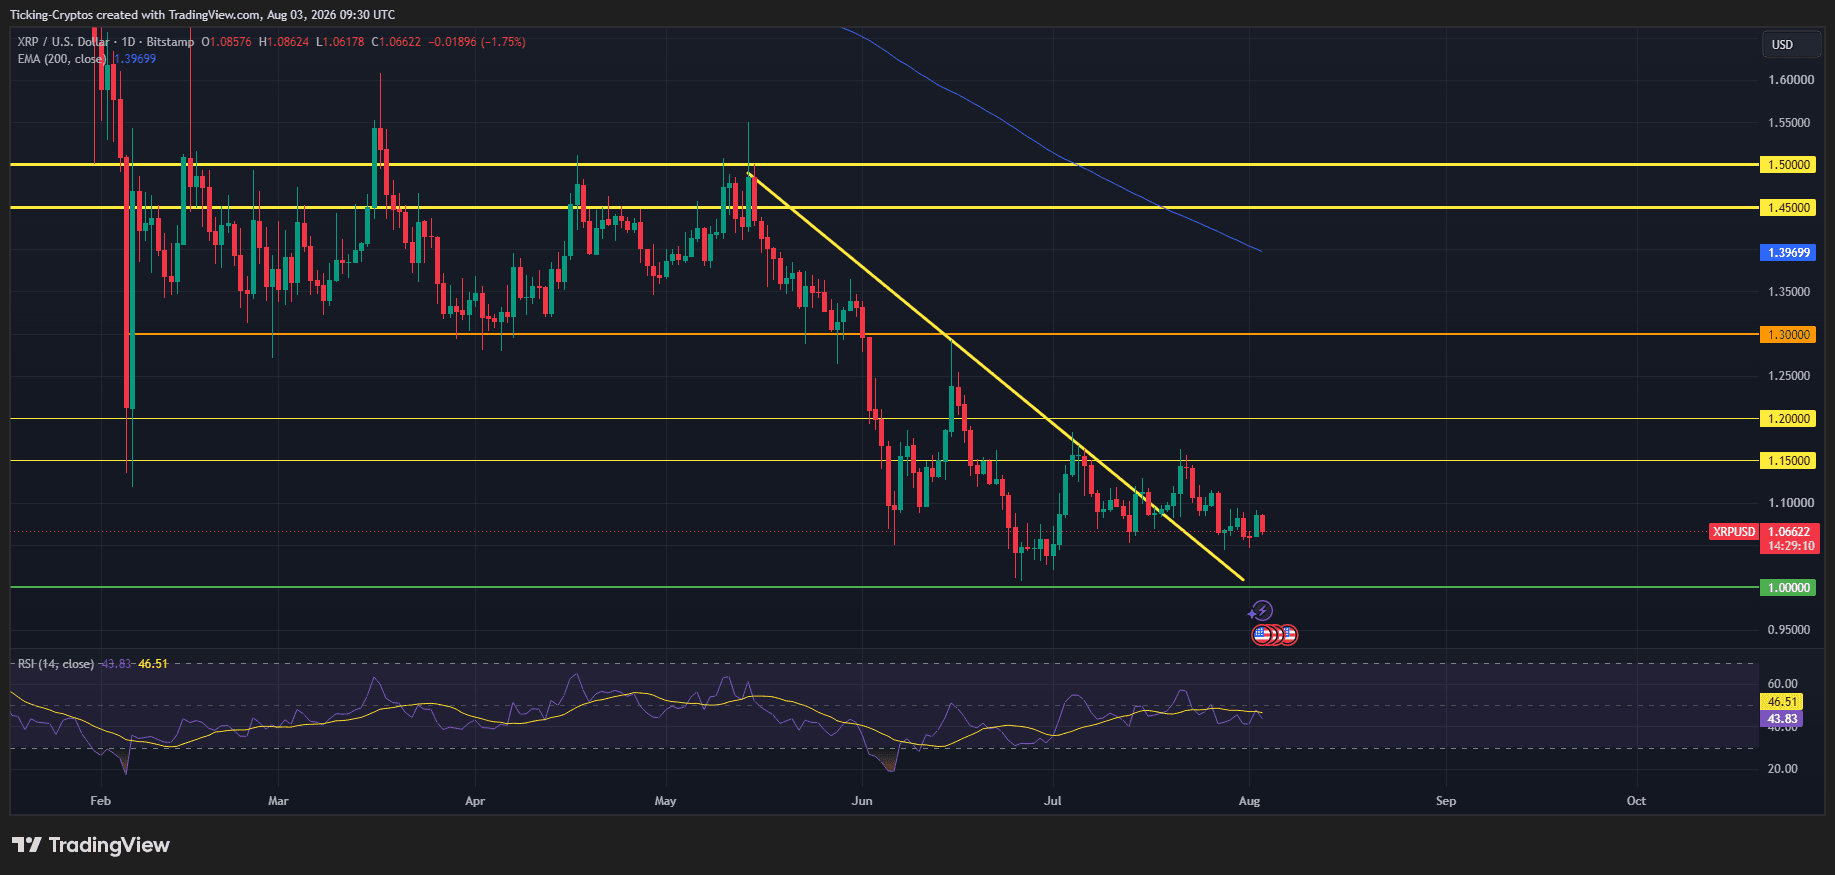
Between those two clusters is where XRP has spent the last nine weeks. The June collapse took price from $1.30 down to the dollar in a matter of days. Since then the token has chopped between roughly $1.00 and $1.19 with a series of slightly lower highs, which is compression rather than accumulation until proven otherwise.
RSI (14) reads 46.51 with its signal line at 43.83. Both sit below the 50 midline. That is not oversold, which matters: the June low pushed RSI toward 30 and produced a bounce. At 46 there is no coiled spring here, just a market with no momentum in either direction.
Has XRP Coin Broken Its Downtrend or Just Paused?
This is the one mildly constructive detail on the chart. The descending trendline drawn from the May high near $1.50 has been sloping down through every bounce since, capping rallies in June and again in mid July. As of the start of August, price has moved above it.
The problem is what happened next, which is nothing. A trendline break that is not followed by expanding volume and a higher high is not a reversal signal, it is a lapsed constraint. XRP has broken the line and then immediately drifted back toward the middle of its range on a red daily candle.
For the break to mean anything, buyers need to close the token above the $1.15 shelf and then reclaim $1.20. Analysts tracking the same structure have converged on that zone as the real trigger. BeInCrypto’s analysis puts the bullish threshold at a three-day close above $1.22, roughly a 10% move from here, and argues that this is the level that would pull ETF desks back into the market.
Until that happens, the more honest read of the chart is a range with a firm floor and a heavy ceiling.
Why Is the $1.00 Level the Whole Story?
Because it is the only support left that has been proven. There is no meaningful horizontal structure between the dollar and the mid $0.80s on this timeframe, which means a decisive daily close below $1.00 opens a fast move toward $0.95 and then $0.85.
That asymmetry is what a buyer at $1.06 is actually taking on. Upside to the first real resistance at $1.15 is about 8%. Downside to the first real target below the range is about 20%. The reward-to-risk only improves if you are buying much closer to the dollar, which is exactly why most desks are treating $1.00 to $1.02 as the accumulation zone rather than current spot.

What Macro Events Are Driving XRP In August?
Three things, and none of them are helping right now.
- The Fed has taken itself off the table. The FOMC held rates at 3.50% to 3.75% on 29 July, the fifth consecutive hold, on a 9-3 vote with the dissenters pushing for a hike rather than a cut. Chair Kevin Warsh again declined to offer forward guidance, leaving September’s path unclear. A restrictive Fed with no cut priced in means liquidity stays tight and leverage stays expensive, which is a structural headwind for altcoins specifically.
- Bitcoin is not providing a bid. BTC closed July around the $63,000 level, up roughly 7% for the month but still pressing against a descending trendline from its October 2025 peak, with all major weekly EMAs sloping down above price. Support at $60,000 to $62,000 has held since the June low. XRP has never sustained a rally while Bitcoin trades below its own long-term averages, and analysts widely flag BTC holding $60,000 as the precondition for any altcoin strength in August.
- Seasonality is genuinely bad. August is the flattest month in XRP’s history at a 0.43% average return, and the token has closed the month red four years running, the longest active losing streak of any month. Analyst ChartNerd notes that in US midterm election years the picture is worse: August 2014 fell 5.7%, 2018 dropped 23%, and 2022 lost 13.7%, averaging around a 14% decline. 2026 is a midterm year. Seasonality is not a trading signal on its own, but it is a reason not to expect a catalyst to arrive out of nowhere.
Demand data matches the mood. Per BeInCrypto, US spot XRP ETF flows registered exactly zero on 10 of July’s 17 trading days, with net monthly demand of roughly $12.4 million against a fund complex holding about $997 million. Daily value traded fell about 37% across the month. Institutional desks are not selling XRP, they have simply stopped showing up.

Does the CLARITY Act Still Matter For XRP?
It matters more to XRP than to any other major token, and its odds are getting worse.
The Digital Asset Market Clarity Act would write XRP’s commodity classification into federal statute and move oversight from the SEC to the CFTC. The SEC and CFTC already named XRP a digital commodity in a joint action on 17 March 2026, but that was interpretive guidance, not law, and a future set of regulators could withdraw it. Pension funds, bank trust desks and asset managers have been waiting on permanence, not interpretation.
The bill passed the House 294-134 in July 2025 and cleared the Senate Banking Committee 15-9 on 14 May 2026. It has sat on the Senate floor calendar since 1 June without a scheduled vote. In late July the Senate formally shelved it to prioritise a Russia sanctions bill and nominations. The Senate returned on 3 August with roughly five working days before recess until 14 September, and Polymarket odds for 2026 passage have slid to around 30%.
This is the crux of the bull case and the bear case at the same time. Standard Chartered’s conditional $8 target requires full Senate passage plus $4 billion to $8 billion in fresh ETF inflows. Without a floor vote, that number is theoretical and the primary institutional catalyst for XRP disappears until at least late 2026, plausibly 2027 given the midterm calendar.
There is real progress on the technology side. The XRP Ledger’s v3.3.0 release targets institutional onboarding, a validator vote is pending on an amendment package covering batch transactions, confidential transfers, sponsored fees and permission delegation, and Ripple Swell runs 27 to 29 October in New York. None of that has moved price in eight months, which tells you what the market is actually waiting for.
So Is XRP Coin a Good Buy At Current Prices?
At $1.06, XRP is a fair buy for a patient position and a poor buy for a trade.
The case for buying is that the downtrend line has broken, the dollar floor has held through five separate tests, exchange supply is reportedly at a seven-year low, sell volume is thin rather than accelerating, and the CLARITY Act remains a live catalyst that would re-rate the asset quickly if it passes. Consensus forecasts cluster around a $1.00 to $1.20 August range with a month-end print near $1.10, which is a market with a floor.
The case against buying now is the reward-to-risk. You are paying 6% above the level where the real support sits, into the weakest month in the token’s history, with the 200 EMA 31% overhead and sloping down, RSI below its midline, ETF flows at zero, and the single catalyst that matters priced at 30% odds and running out of legislative calendar.
The practical read: scale in near $1.00 to $1.02 rather than chasing here, treat a daily close below $1.00 as the invalidation, and require a three-day close above $1.20 to $1.22 before treating any bounce as the start of a trend rather than another lower high. If the Senate schedules a floor vote before recess, that timeline compresses fast. If it does not, September is the earliest the story changes.




Be the first to comment