



Bitcoin’s [BTC] price seemed to be struggling within the $60,000 and $64,000 range for most of the week. In fact, such was its movement that it sparked hopes of a potential bottom.
One on-chain metric that added to the narrative of a potential bottom and a major rally ahead was the Bitcoin Supply Sell-Side Exhaustion Constant. At the time, this metric had fallen to a historical low level on the chart. This finding implied that Bitcoin was recording low volatility, as well as a fall in profitability.
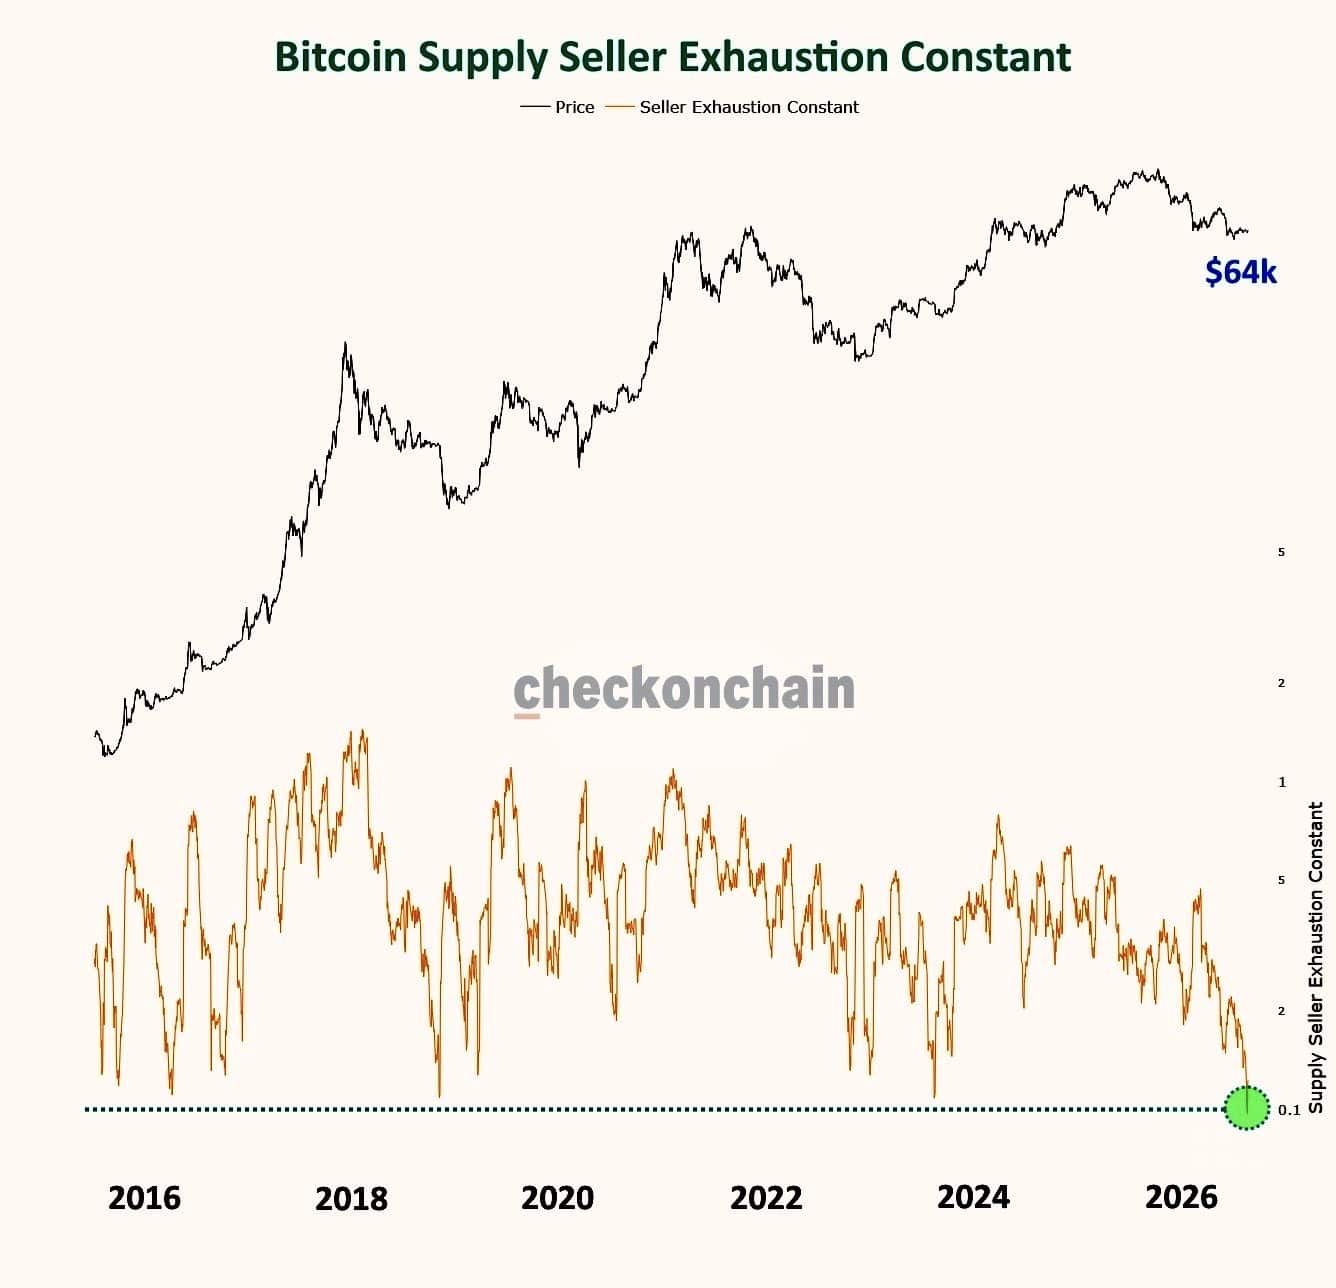
That changed in the latter hours of 19 August after the crypto recorded a significant hike to trade close to $70,000 on the charts. The scale of this rally implied that perhaps, the aforementioned metric simply hinted at the possibility that sellers may be exhausted.
Can Bitcoin sustain this run though? Well, other factors could actually determine whether there’s growing confidence and demand in the market. Worth pointing out, however, that at press time, the market seemed bullish in the short term.

A hike in profit-loss action
Growing profit and loss realization has been affecting the market lately. This, according to the uptick in Bitcoin’s Adjusted Sell-Side Risk Ratio (aSSRR).
The metric recently hit 20.23% on the charts, implying that the magnitude of this realization may be increasing. Especially relative to the present market size.
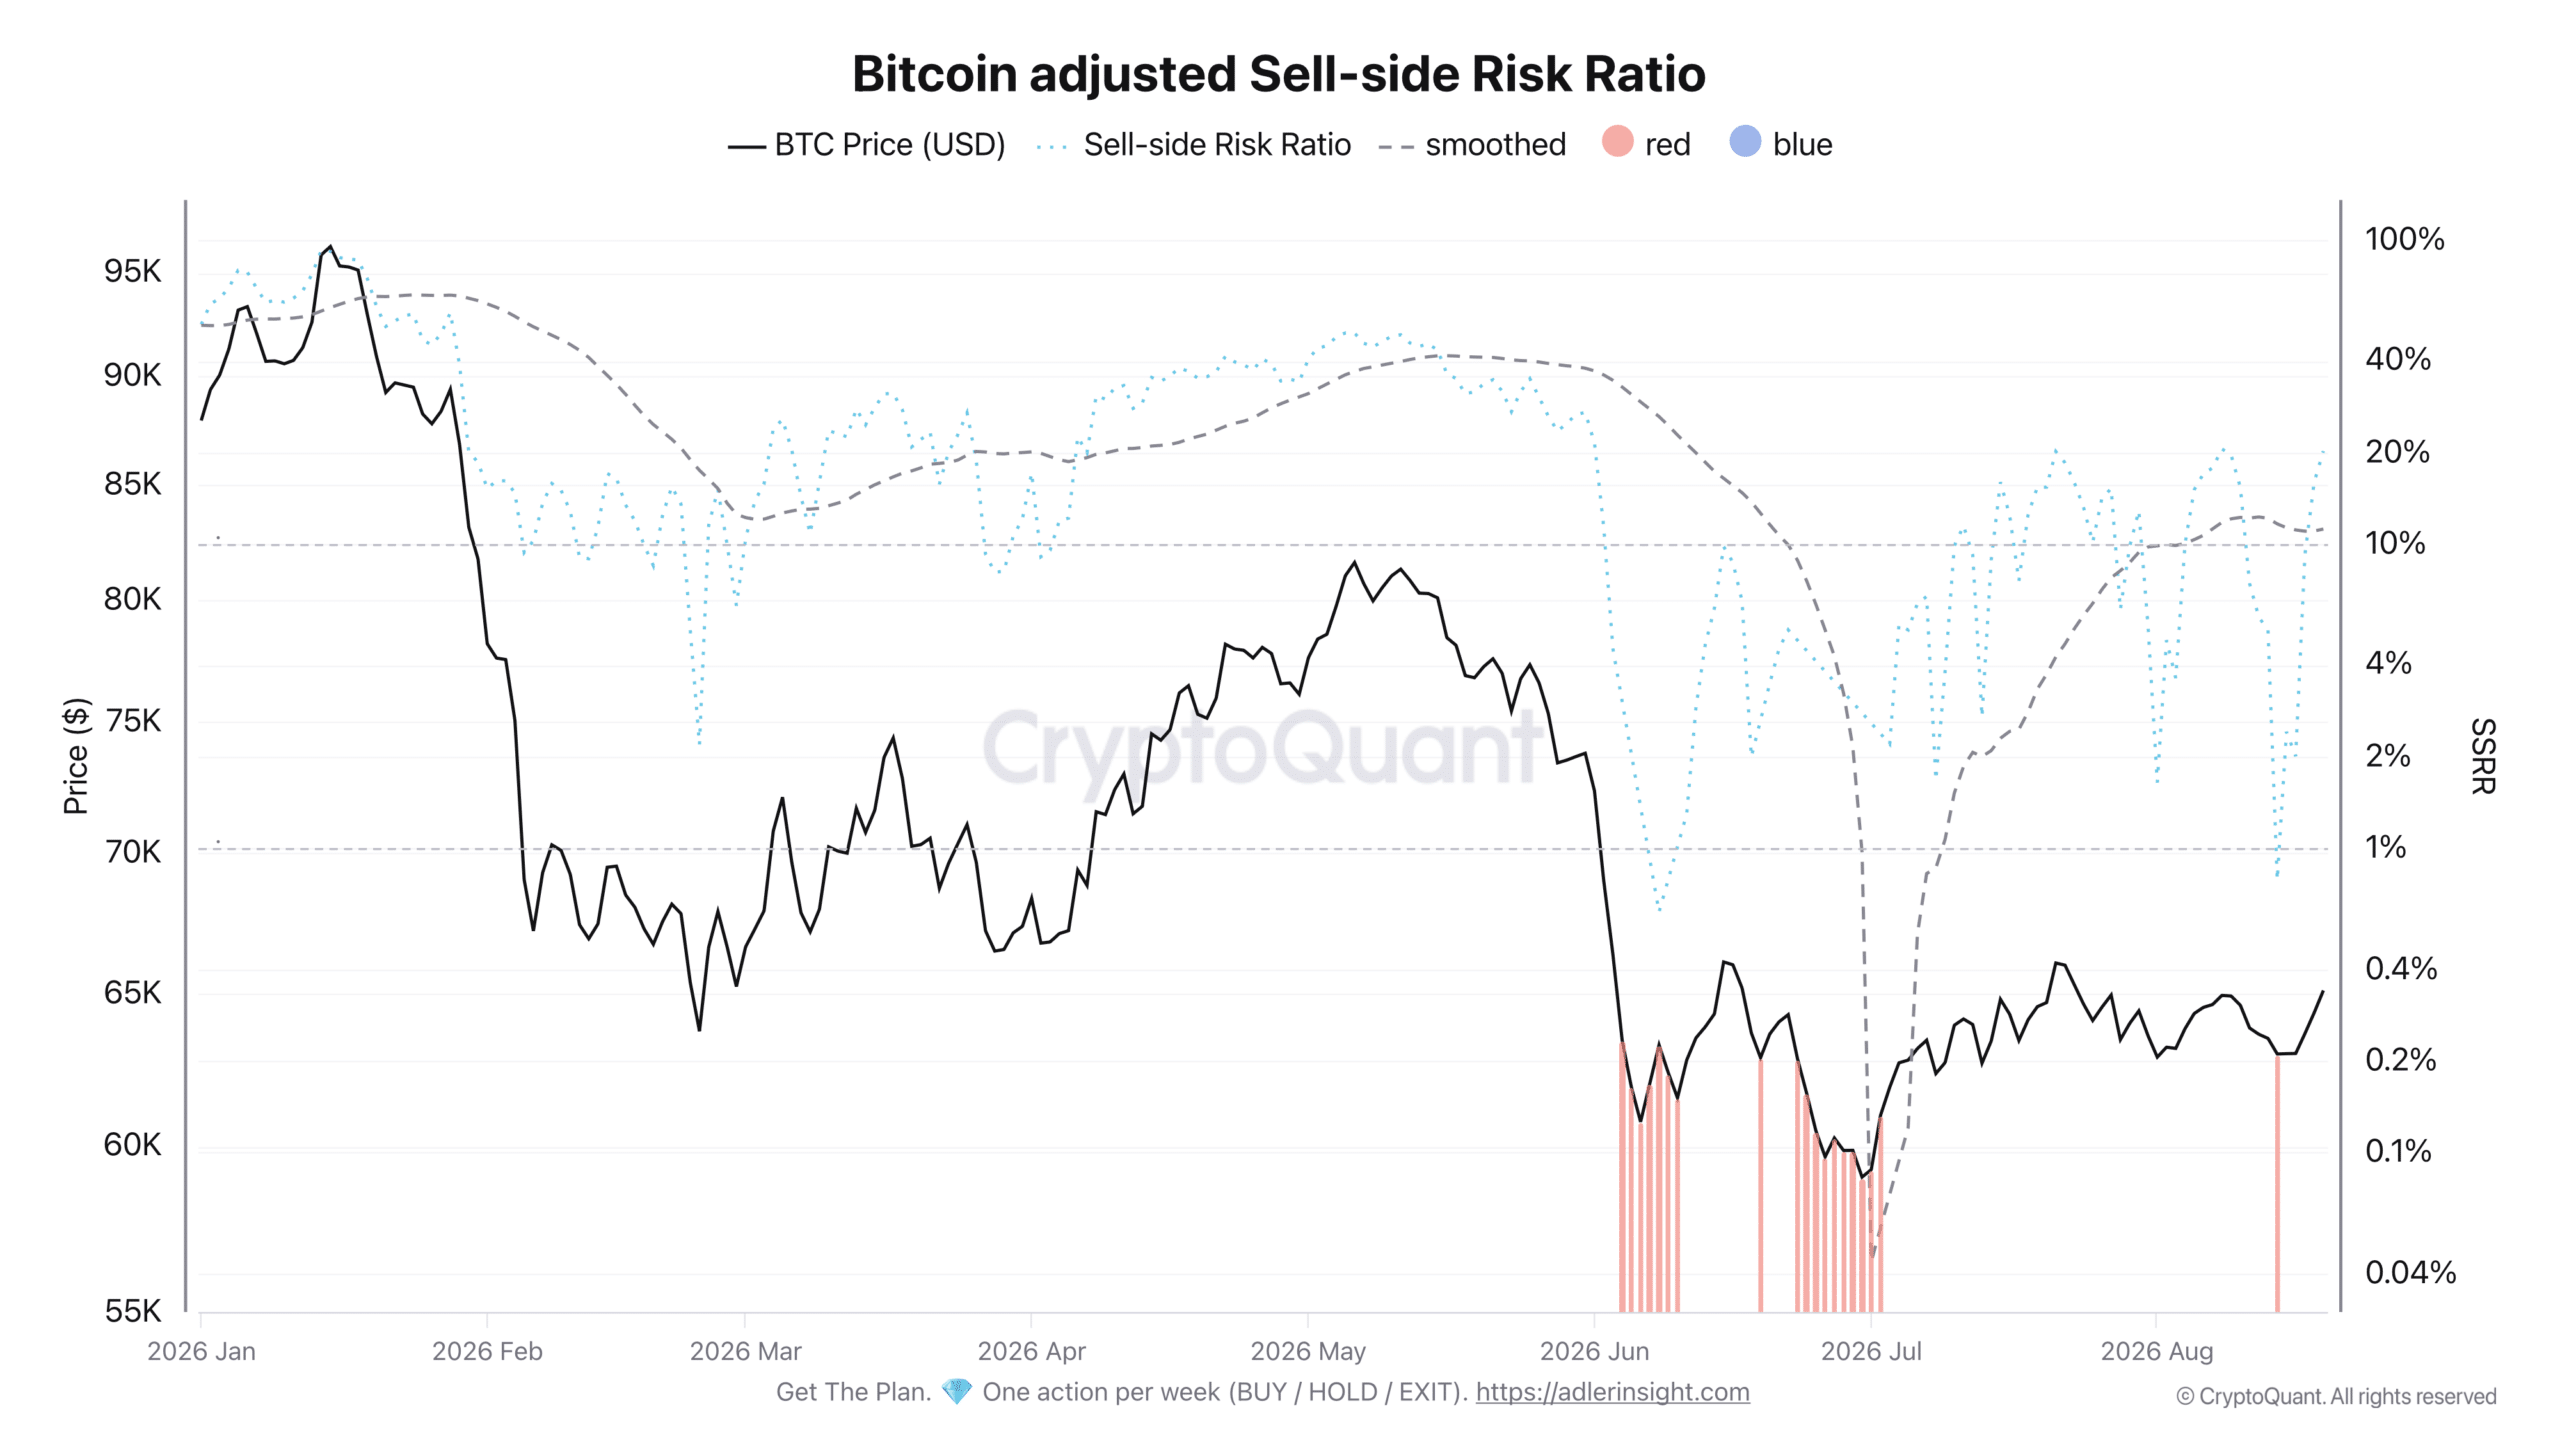
This hike began on 14 August as the previous week’s bottom formed. This could mean that the main influencing factor has been the rise in profit-taking, especially as the price rallied this week.
A look at the Net Realized Profit/Loss indicator, specifically the 7-day Short-Term Moving Average (SMA), highlighted a clear hike. This suggested that the majority of the action is being led by profit realization.
This could have a meaningful impact on the market if buyers fail to absorb the growing profit-taking, potentially creating resistance to further upside. At the time of writing though, momentum was still bullish.
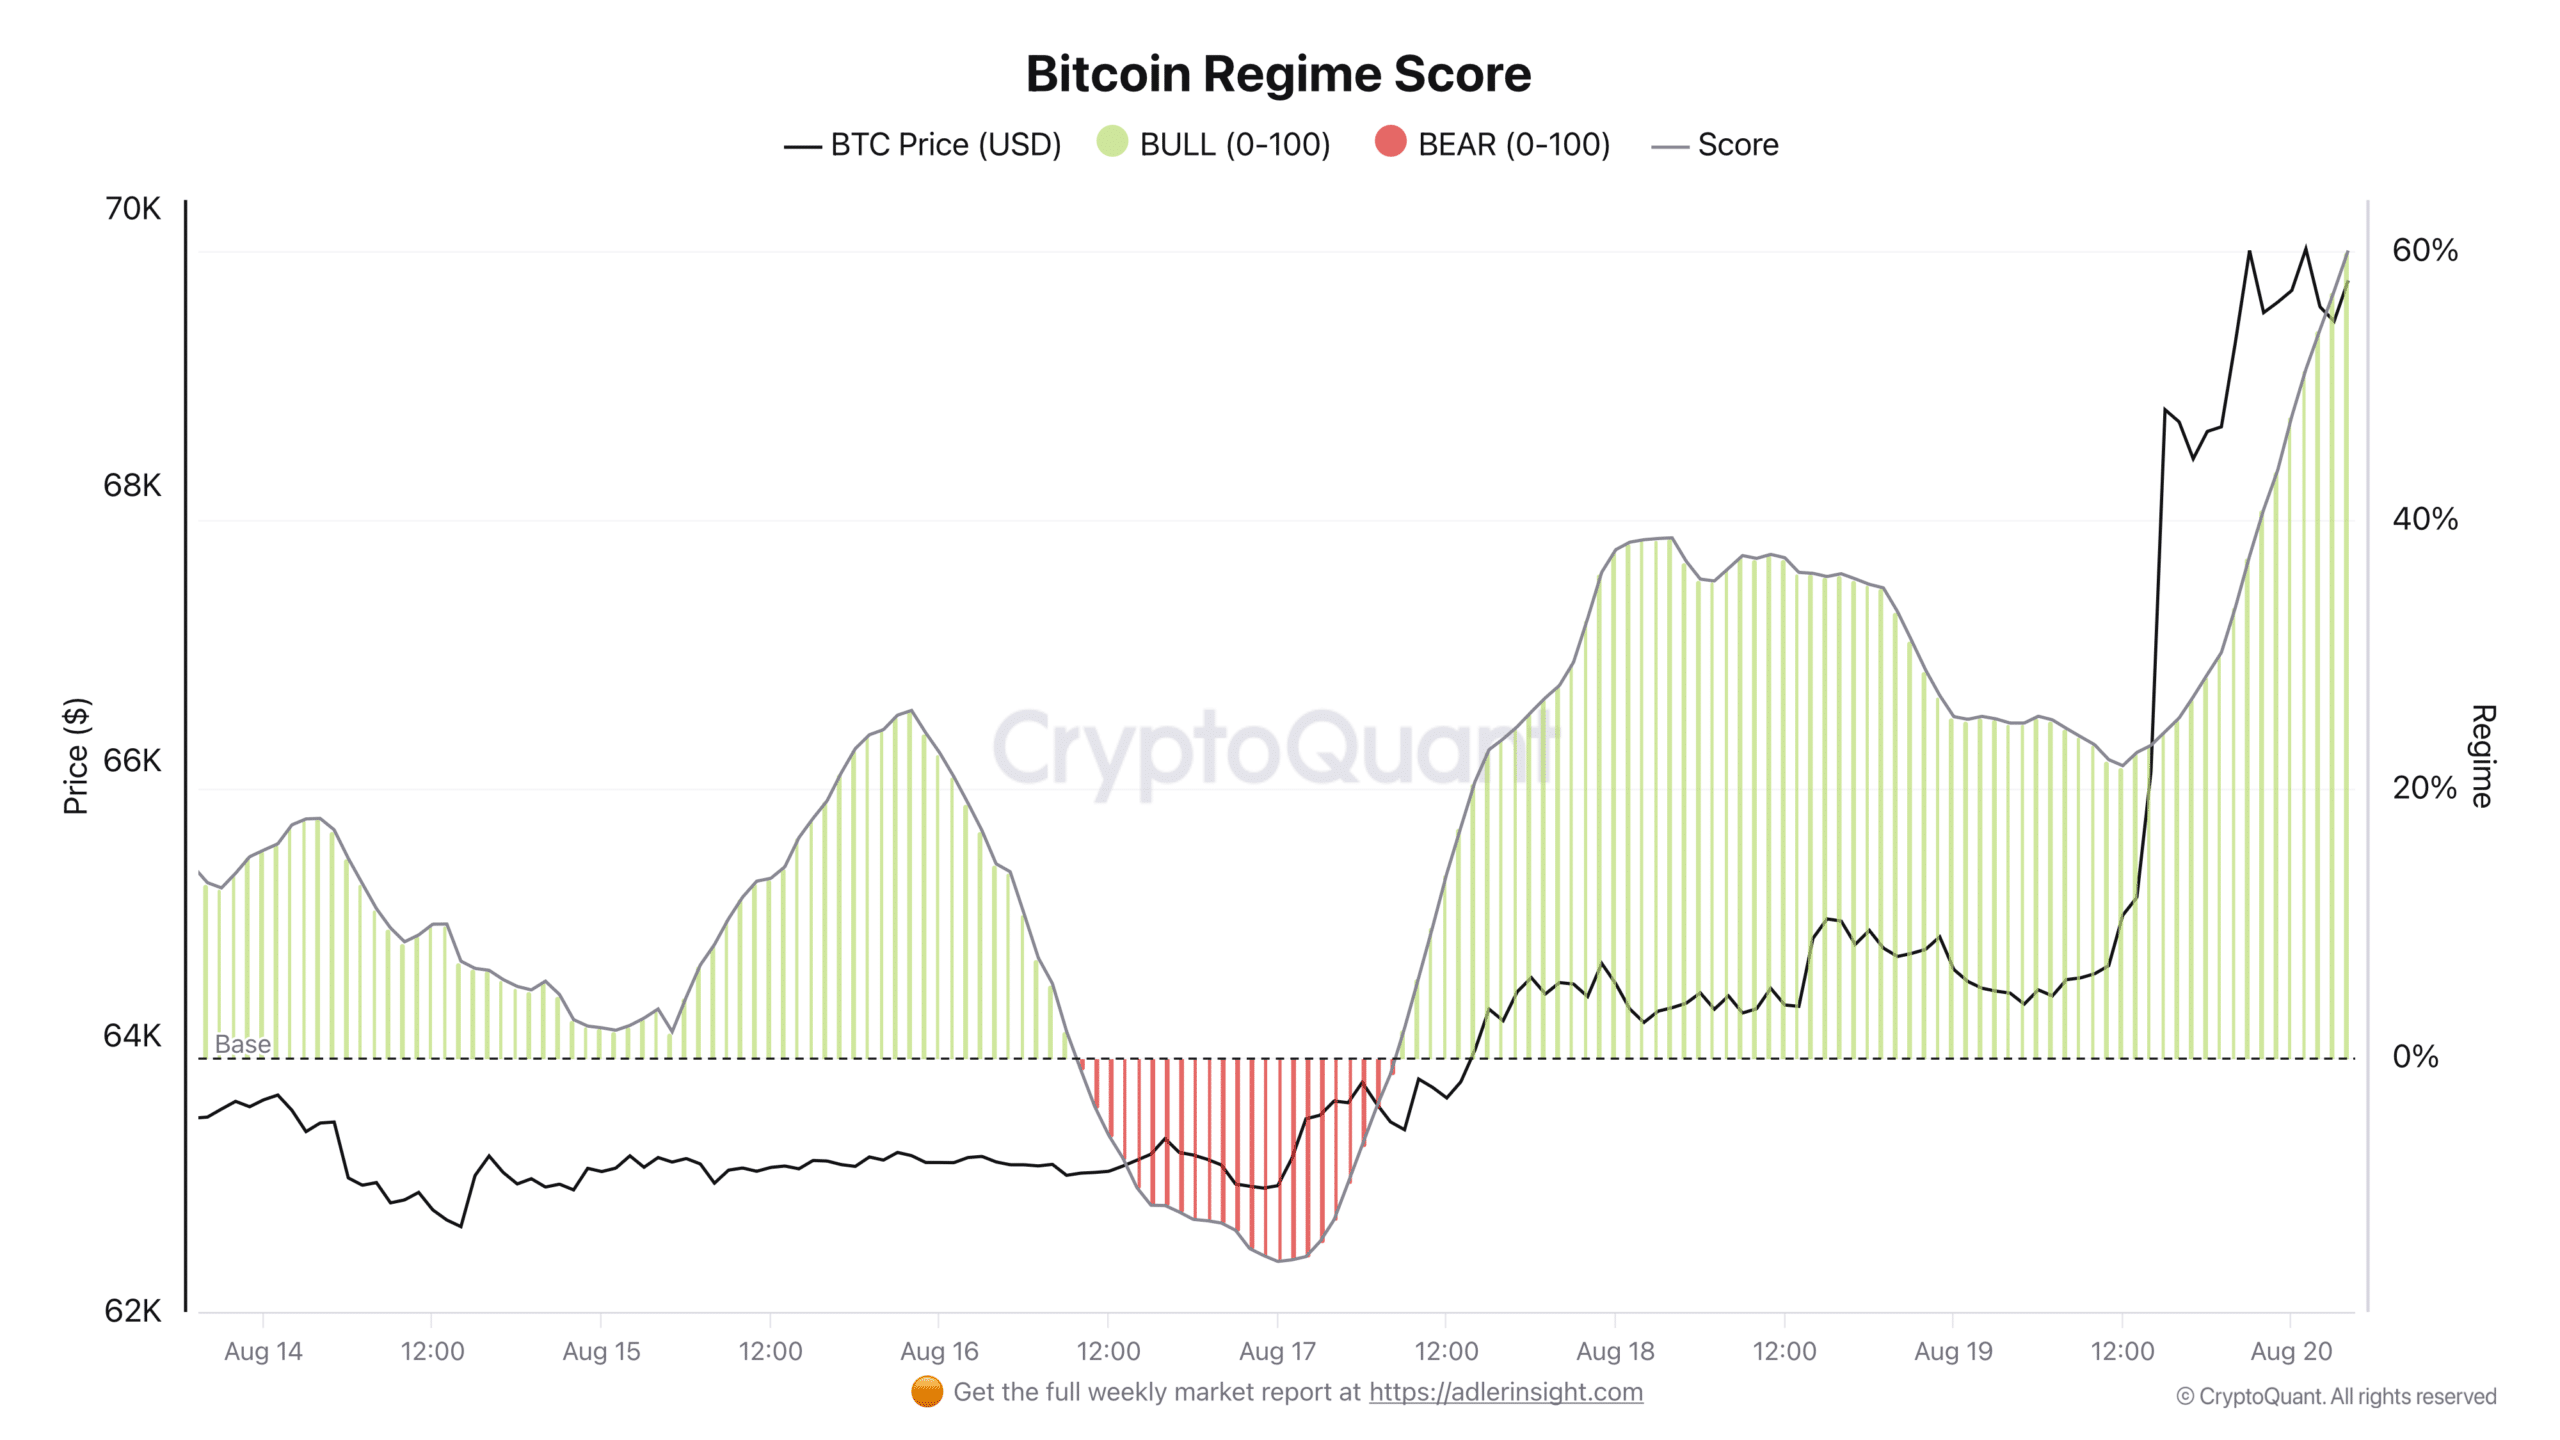
The Bitcoin Regime Score crossing 60% in the last 24 hours can also be seen as another bullish indicator.
This suggested that there’s a strong conviction that the price will continue in its present trajectory.
Spot flow’s impact on the price
Finally, the spot market data showed that there’s been more profit-taking in the market in the last 30 days as inflows dominated the outflows.
On the back of Bitcoin’s rally over the last 24 hours, the netflow stood at roughly $233 million. Over a 30-day period, the netflows were worth $556 million, with a majority coming from the massive inflows recorded over the last seven days.
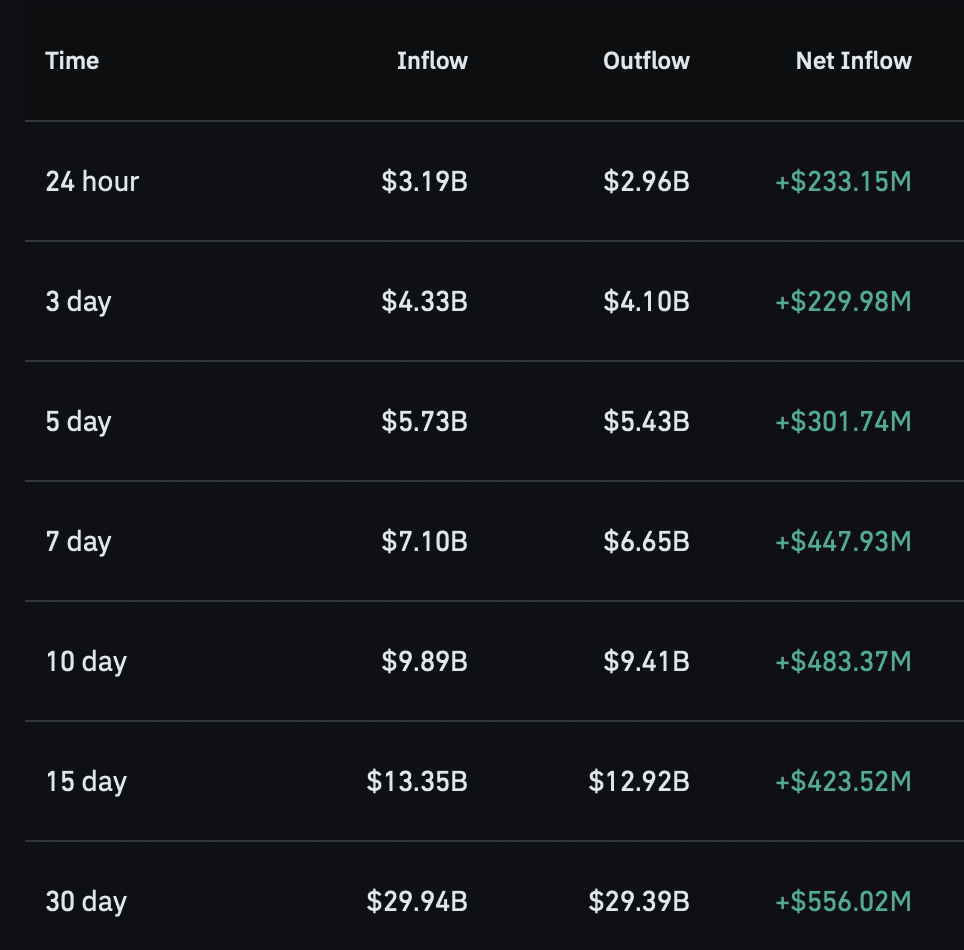
Until there’s clear demand and the spot market maintains a consistent negative netflow, the chances of a price pullback will be high.
Final Summary
- Bitcoin’s sell-side exhaustion hit historic lows, preceding the rally that pushed BTC close to $70K.
- Rising profit-taking and positive spot netflows could limit Bitcoin’s upside unless stronger demand emerges.


Be the first to comment