



BONK is showing signs of a bullish reversal as an inverse head-and-shoulders pattern develops. A confirmed breakout could strengthen buying momentum and support further upside, while RSI and MACD remain bullish. However, fading MACD histogram strength suggests short-term consolidation before the next move.
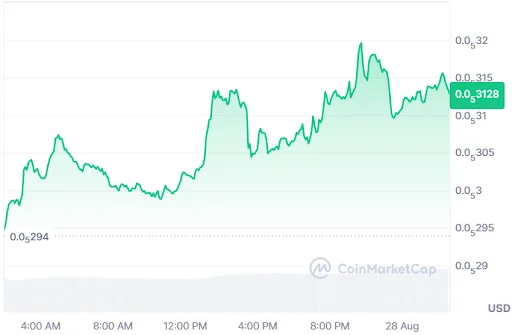
At the time of writing, BONK is trading at $0.000003130 with a 24-hour trading volume of $48.94 million and a market capitalization of $275.41 million. Following the 4.8% gain over the last 24 hours, the BONK price structure and network growth point to a bullish reversal ahead.
Source: CoinMarketCap
Also Read: BONK Price Prediction: Triangle Pattern Hints at Major Breakout Ahead

BONK Price Eyes Breakout Toward $0.00000334
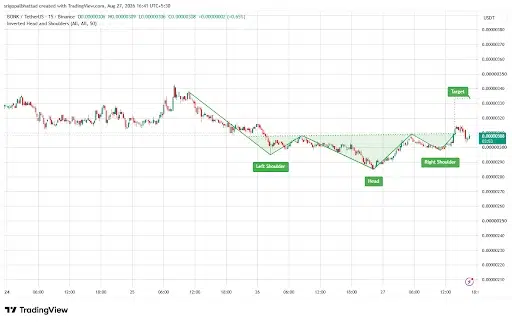
However, the crypto analyst Crypto With Gopal pointed out that BONK is forming a potential inverse head-and-shoulders pattern on the 15-minute chart, signaling a possible bullish reversal.
The structure features two shoulders surrounding a deeper head, while price is testing the neckline near $0.00000308. A decisive breakout above this resistance, supported by stronger volume, could confirm the pattern and shift momentum toward buyers.
Source: Crypto With Gopal’s X Post
With BONK breaking above the neckline at $0.00000308, we would expect the price to move upwards with an initial target of $0.00000334.
But the formation is still unvalidated since the price needs to move above resistance for validation. The breakdown of the neckline will likely result in a retrace or consolidation below $0.00000308.
RSI and MACD Point to a Bullish Reversal Ahead
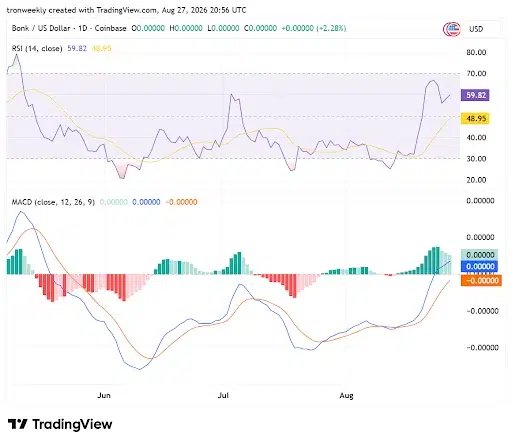
According to TradingView, the Relative Strength Index (RSI 14) for the daily chart is rising in bullish power, having reached 59.82.
The indicator is trading comfortably above its 48.95 line, thus signifying that it is a bullish one with good momentum. While RSI has dropped from its highs, the line is curling upwards again and shows that buyers keep buying.
Source: TradingView
MACD continues to be in a positive direction, with the MACD line above the signal line. The green bars of the histogram are gradually fading into lighter tones, despite the bullish setup formed till August, which implies that although there is a consolidation of momentum, the buyers remain in control of the market.
What Comes Next for BONK?
The BONK price is bound to depend on the ability of the buyers to go past the neckline at $0.00000308.
A successful breakout along with increased volume would affirm the inverse head and shoulders formation and result in an uptrend for BONK towards $0.00000334. The failure to move past the resistance may result in consolidation.
Also Read: BONK Price Faces 80% Downside Risk as Bearish Trend Deepens
This article contains market analysis and price predictions. These are not guarantees. Crypto markets are volatile. Always DYOR. Not financial advice.



Be the first to comment