


Bitcoin traded near $77,500 on Sept. 1 as rising oil prices, higher bond yields and renewed US rate-hike concerns outweighed strong spot ETF inflows, while short-term technical indicators pointed to weakening momentum.
Summary
- Bitcoin fell 1.6% in 24 hours after retreating from an intraday high near $79,225.
- The 4-hour price reached its lower Bollinger Band as trend strength dropped to a weak reading.
- US spot Bitcoin ETFs recorded $216.7 million in net inflows during the latest completed session.
- Liquidation data show leveraged positions clustered near $76,500–$77,000 and above $79,500.
Bitcoin price loses short-term support
According to data from crypto.news, Bitcoin (BTC) price was trading around $77,500 at the time of writing, down approximately 1.6% over the previous 24 hours. The asset reached $79,225 earlier in the session before sellers pushed it to an intraday low of $77,318.

The retreat took Bitcoin below the $77,700–$78,000 short-term support range and left it about 4.6% below the recent local high near $81,280.
BTC remains well above its main daily moving averages despite the pullback. The daily chart places the 20-day simple moving average at $73,198, while the 50-day and 100-day averages sit at $67,924 and $66,285, respectively.
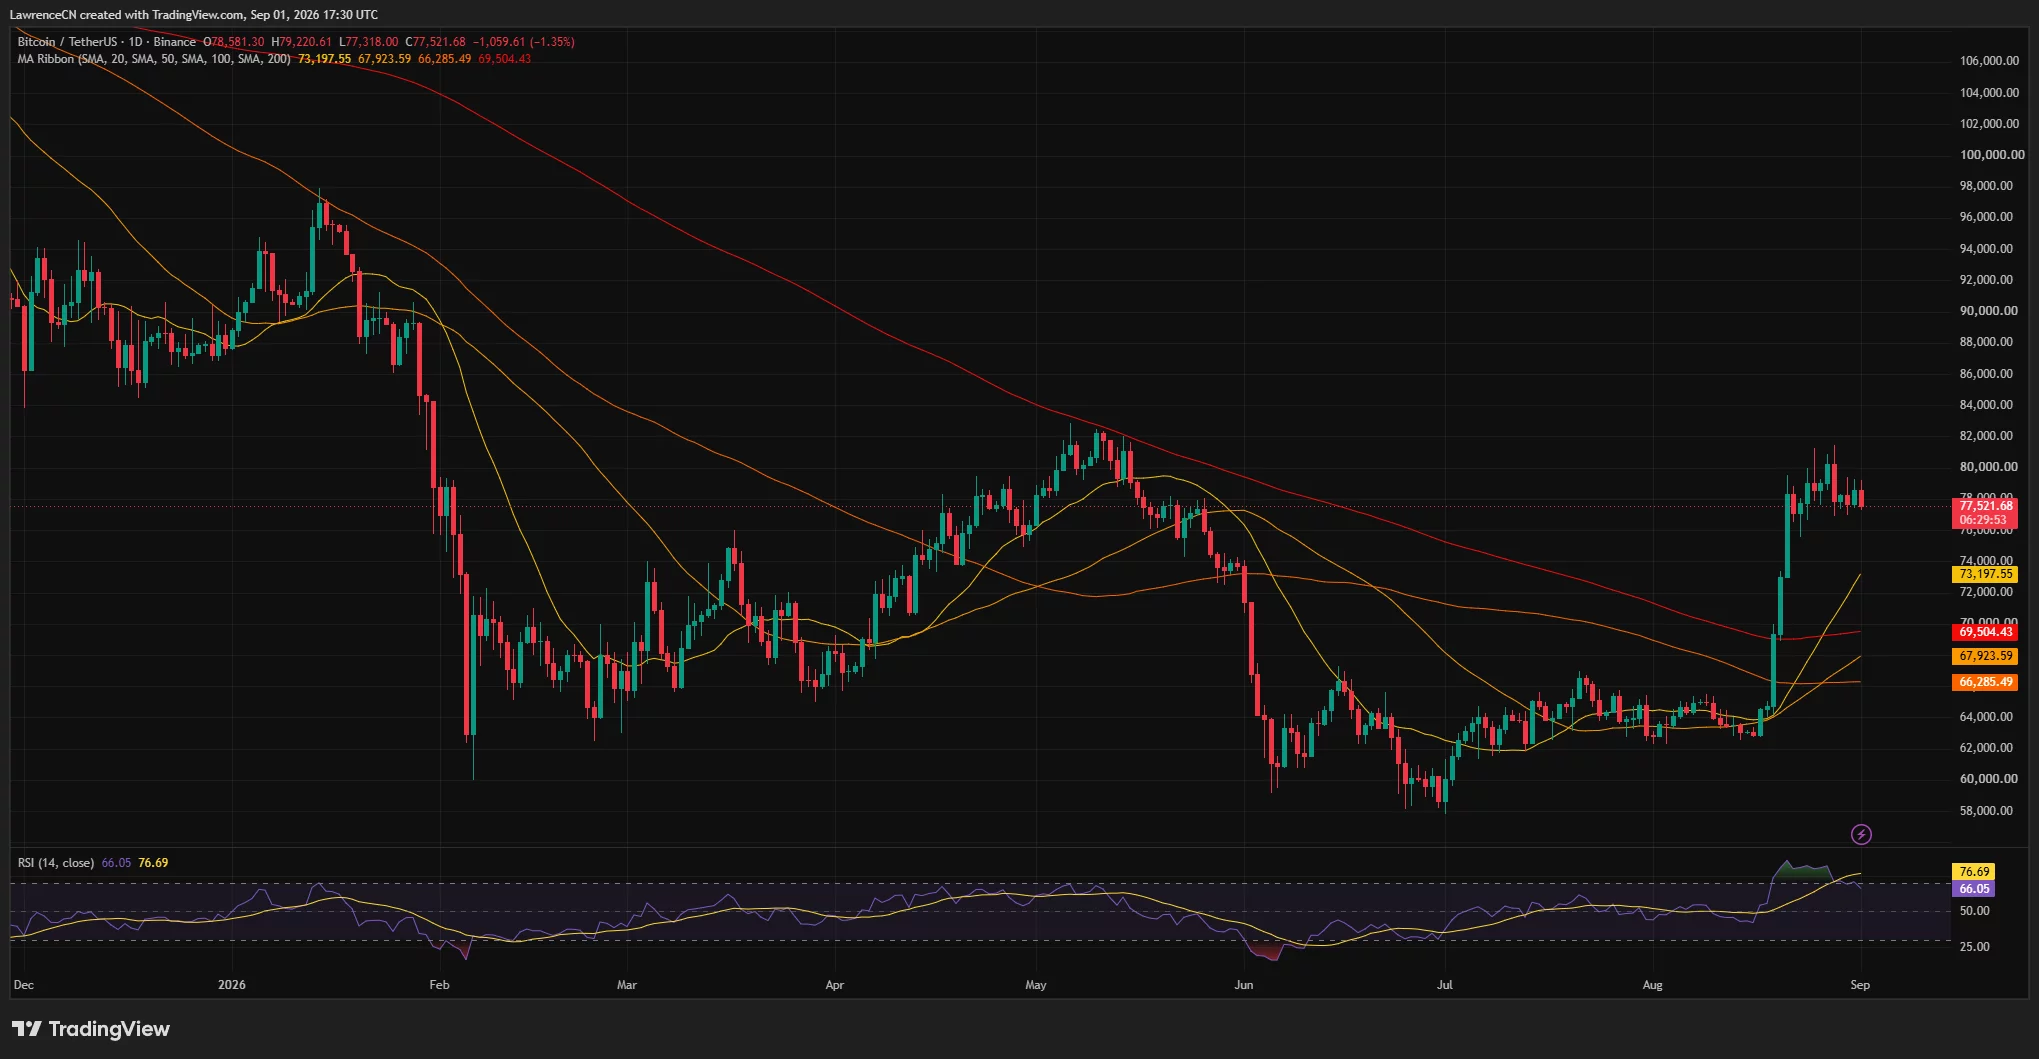
Bitcoin also remains above the 200-day SMA near $69,504. The alignment leaves the broader trend constructive, as shorter moving averages have moved above their longer-term counterparts following August’s rally.
Daily momentum has started to cool, however. The relative strength index has fallen to 66 from an earlier overbought reading above 70. An RSI above 50 still favors buyers, but the decline suggests the market is losing some momentum after its rapid move from the $64,000 area.
Rising oil prices and yields pressure Bitcoin
The pullback followed renewed pressure across global markets as oil prices and government bond yields moved higher.
Brent crude rose roughly 2% to $92.04 per barrel as renewed fighting between the United States and Iran revived concerns over supply disruptions.
More expensive energy can keep inflation elevated by raising transportation and production costs. Persistent inflation would reduce the Federal Reserve’s room to lower interest rates and could revive expectations for tighter US monetary policy.
A simultaneous global bond selloff pushed yields higher, adding pressure to risk assets. Rising yields make interest-bearing government securities more attractive relative to assets such as Bitcoin, which does not generate a fixed return.
The macro pressure arrived despite renewed demand for US spot Bitcoin exchange-traded funds. Farside Investors data show that the products attracted a combined $216.7 million during the latest completed trading session.
BlackRock’s IBIT accounted for $205.9 million of the total. The daily inflow reversed the $201.9 million net withdrawal recorded on Aug. 28, though Bitcoin’s subsequent decline suggests macro-related selling temporarily exceeded ETF demand.
4-hour indicators point to weak momentum
Bitcoin’s 4-hour chart shows the price testing the lower Bollinger Band at approximately $77,473. The band’s middle line stands near $78,262, while the upper boundary sits at $79,050.
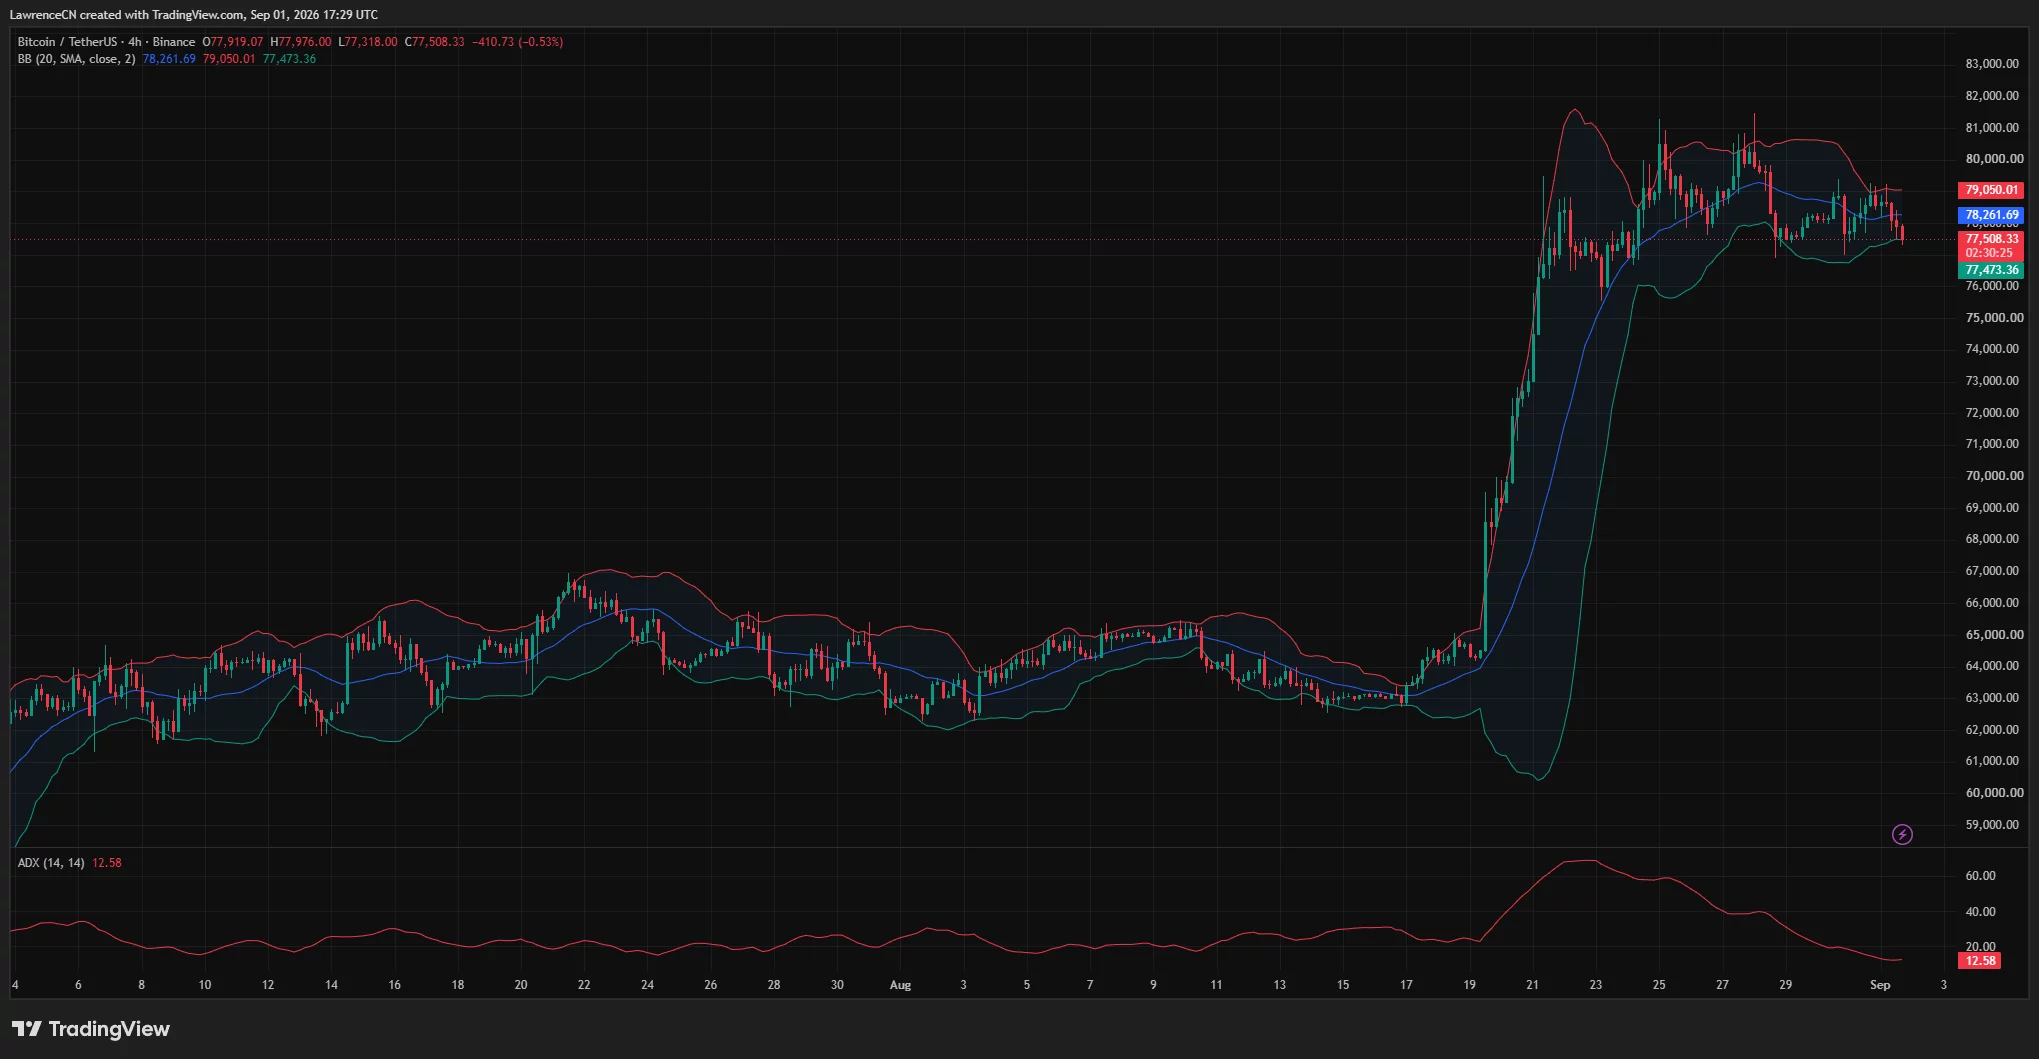
Trading near the lower band reflects immediate selling pressure, but it does not confirm a larger breakdown by itself. A recovery above the middle band would put $79,050 back in focus, while a 4-hour close below the lower boundary could expose the recent lows.
The average directional index has dropped to 12.6 on the same timeframe. An ADX reading below 20 normally indicates that neither buyers nor sellers control a strong trend, making range-bound and uneven price action more likely.
BTC would need to recover the $78,260 Bollinger midpoint before challenging $79,050. Above that level, the $79,500–$80,000 zone represents the next major resistance area, followed by the recent peaks between $80,800 and $81,300.
Failure to recover the middle band would leave Bitcoin vulnerable to another test of $77,000. A confirmed close below that level would weaken the short-term structure even though the daily moving averages remain bullish.
Liquidation clusters surround the current price
CoinGlass’s one-week liquidation heatmap shows a growing concentration of leveraged positions just below Bitcoin’s current market price.
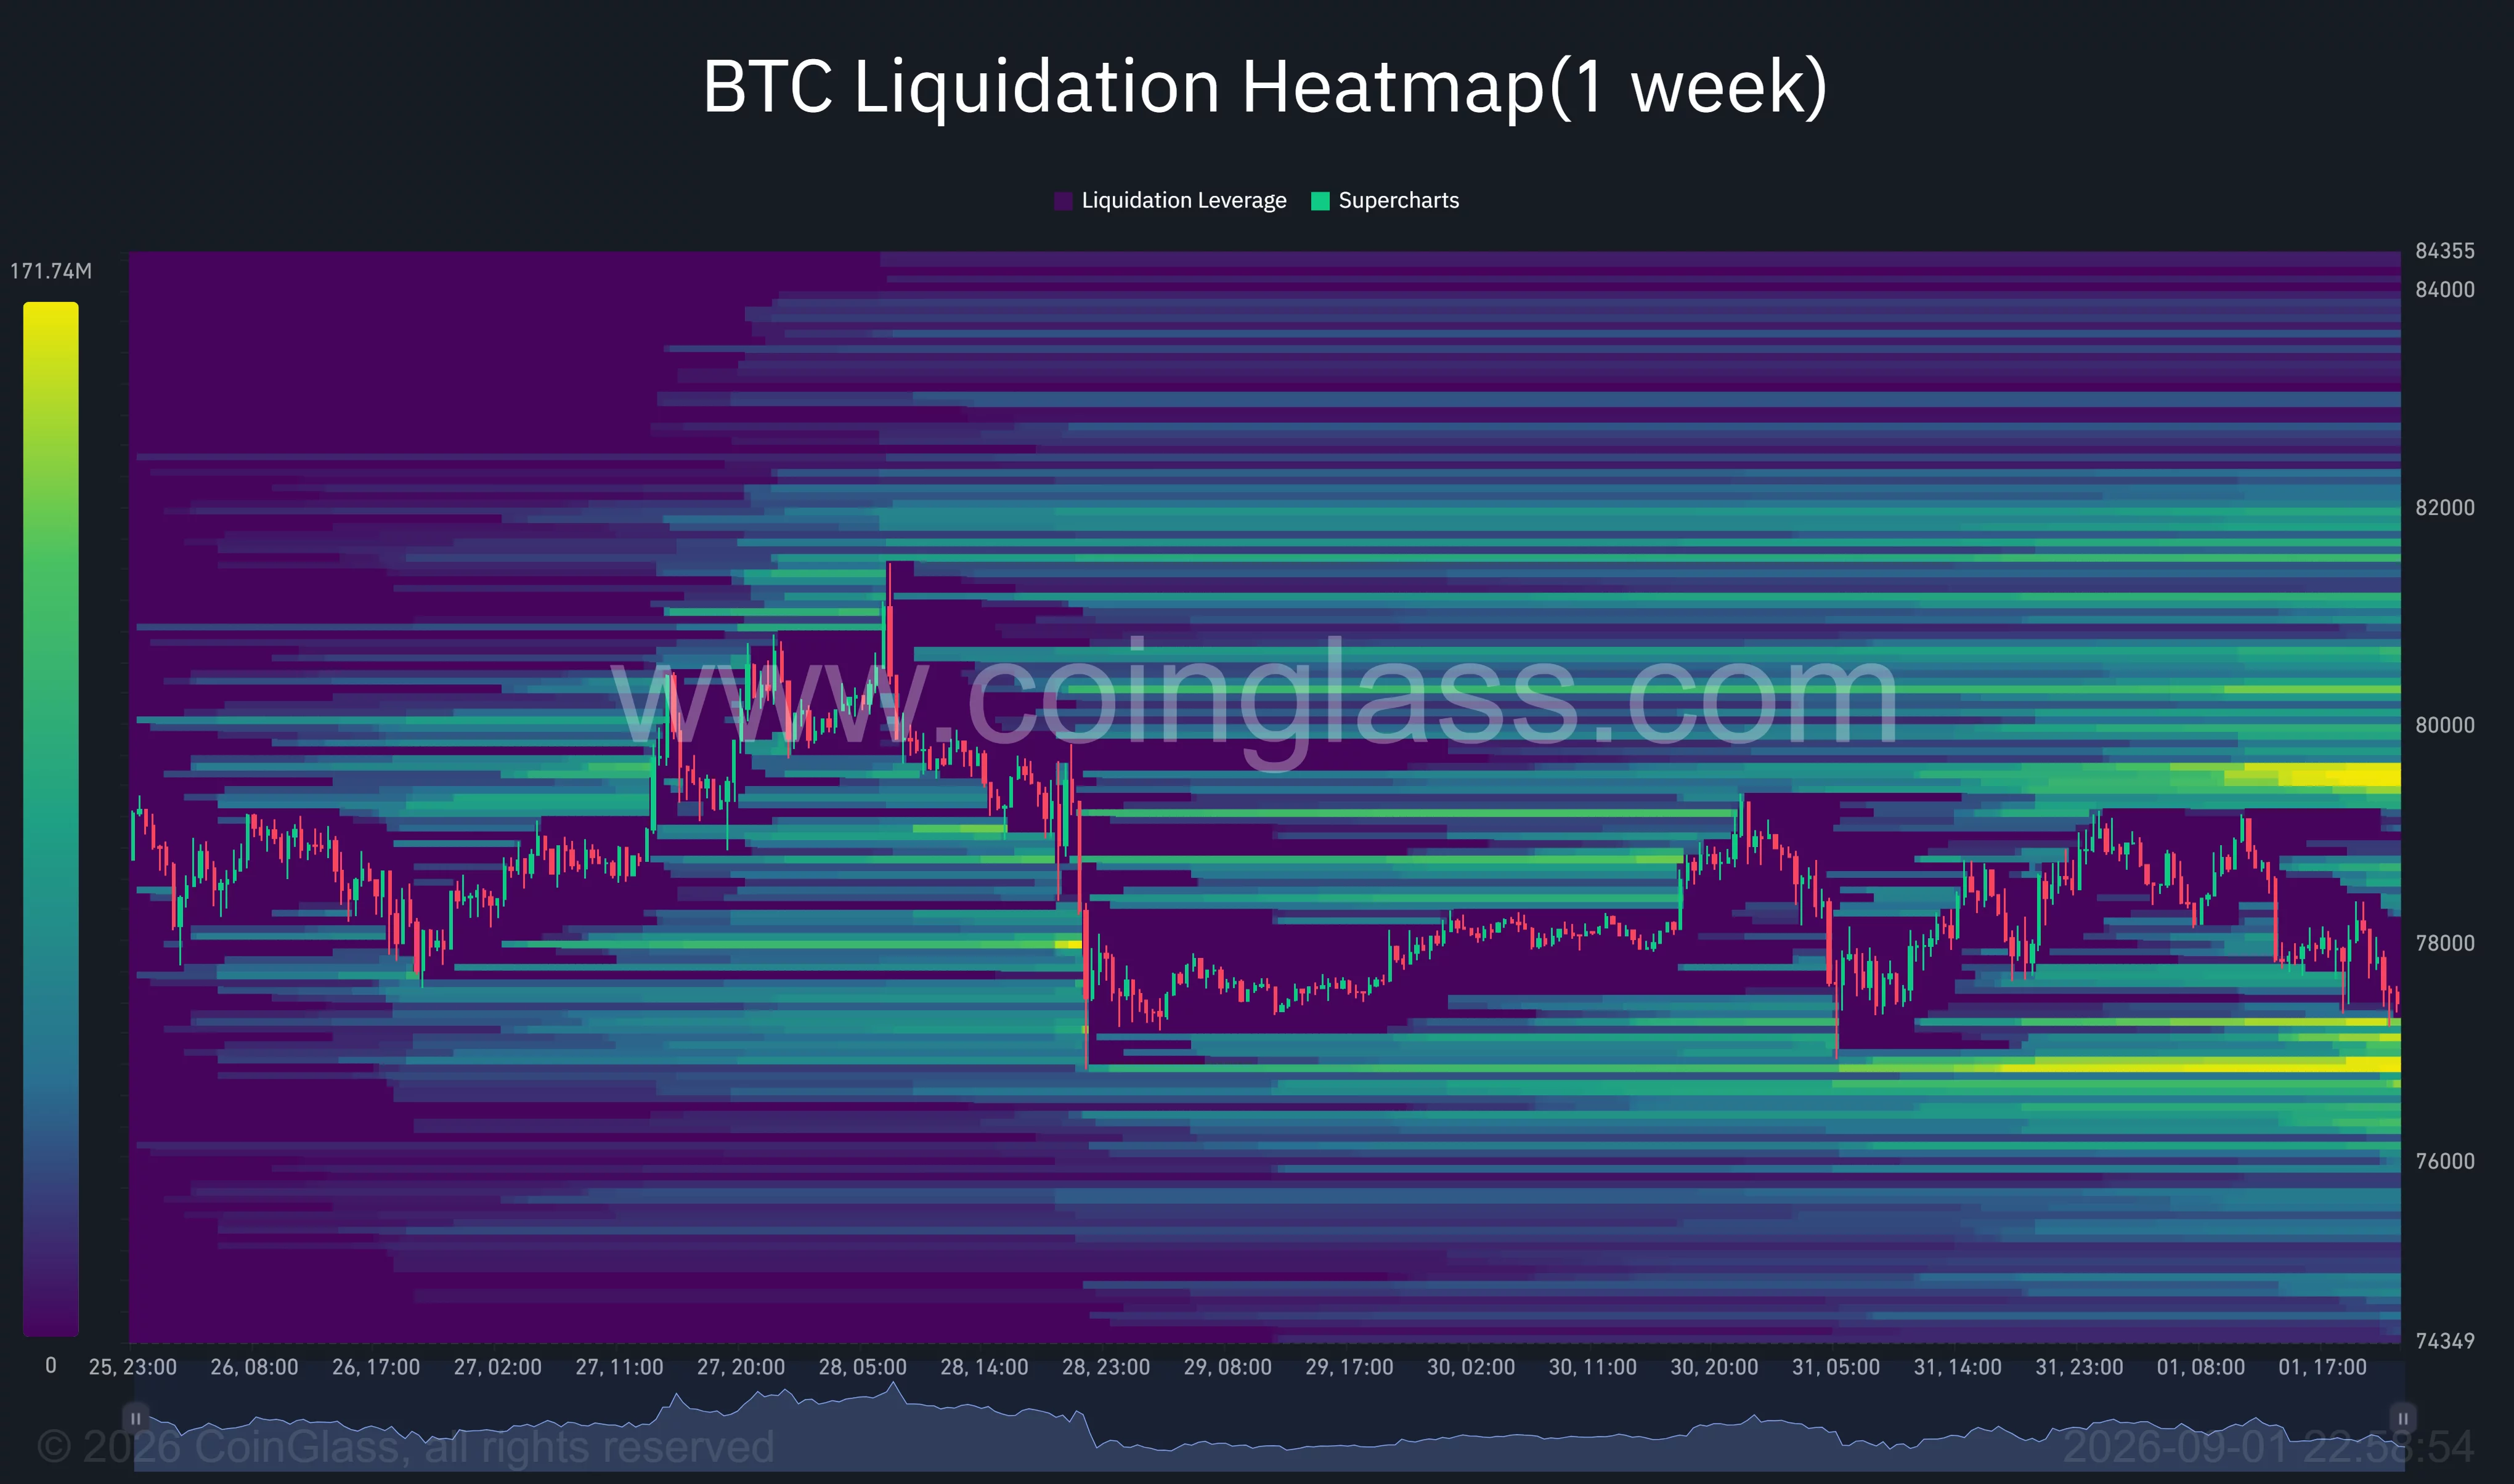
The nearest liquidity cluster appears between approximately $76,500 and $77,000. A larger downside pool is visible closer to $76,000, giving traders two nearby levels to watch if selling accelerates.
Upside liquidity is concentrated around $79,500, with additional clusters between $80,000 and $82,000. Price can gravitate toward areas containing large concentrations of leveraged positions, but the heatmap does not predict which cluster will be reached first.
Derivatives data do not currently point to widespread forced deleveraging. Notably, about $33 million in Bitcoin liquidations, including $19.6 million in long positions and $13.4 million in shorts.
Bitcoin futures open interest stood near $25.3 billion, rising only 0.6%–0.9% over 24 hours. Average funding remained positive at 0.0066% per eight hours, below the commonly referenced 0.01% baseline. The combination suggests leveraged traders remain positioned, but bullish exposure is not yet unusually crowded.
Bitcoin must defend the $76,500 support zone
The $76,500–$77,000 region is Bitcoin’s main immediate support. The lower 4-hour Bollinger Band and a nearby liquidation cluster add technical importance to that range.
A sustained break below $76,500 could extend the decline toward $75,700–$76,000. If buyers fail to defend that secondary area, the daily chart points to $72,500–$73,200 as the next major support, with the 20-day SMA reinforcing the upper end of the zone.
The bullish scenario requires Bitcoin to reclaim $77,700–$78,260 and then close above $79,050. A move through $79,500–$80,000 could trigger liquidations among short positions and reopen the path toward $81,000–$82,000.
Pseudonymous trader Eliz maintained a longer-term bullish view despite the short-term volatility, describing purchases above the $65,000–$68,000 range as a “bargain” and saying Bitcoin would eventually trade higher. The forecast remains the trader’s opinion rather than a confirmed market outcome.
For US investors, oil prices, Treasury yields and expectations for the Federal Reserve’s next policy decision remain the main external catalysts. ETF inflows continue to provide institutional demand, but Bitcoin’s next directional move may depend on whether buyers can defend $76,500 while macro conditions remain restrictive.
Disclosure: This article does not represent investment advice. The content and materials featured on this page are for educational purposes only.



Be the first to comment