



SUI price regained momentum on Thursday, September 3, 2026, after its late-August decline. Analyst Ali Martinez identified a reversal signal, while Kravata launched Sui-based payment services for Latin American users.
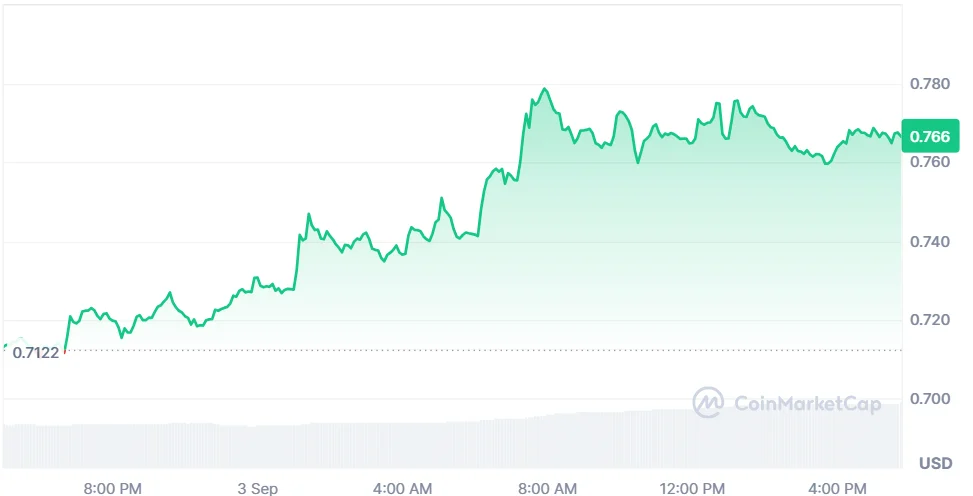
As of writing, SUI is trading at $0.7668, marking an increase of 7.54% in the past day. The trading volume is showing a strong bullish surge up 49.43% and is currently standing at $578.04 million. Over the last week, the token has gained 0.56%, according to CoinMarketCap.
Also Read: Bitcoin Price Faces a Critical $83K Test Amid Mixed ETF Flows
Why SUI Price Could Rebound From the $0.70 Support Zone
Crypto analyst Ali Martinez highlighted that there is a TD Sequential “9” bullish pattern on the daily SUI price chart. It is formed after a relatively long period of decreasing candlesticks, after the August market correction.

The traders use the TD Sequential indicator for finding signs of trend exhaustion. However, it does not mean that a new upward trend is forming until the price confirms it.
The pattern is created when the price of SUI reached the support level at $0.70-$0.72. The buyers have been returning back to this zone on several trading sessions, which helped limit deeper selling pressure.
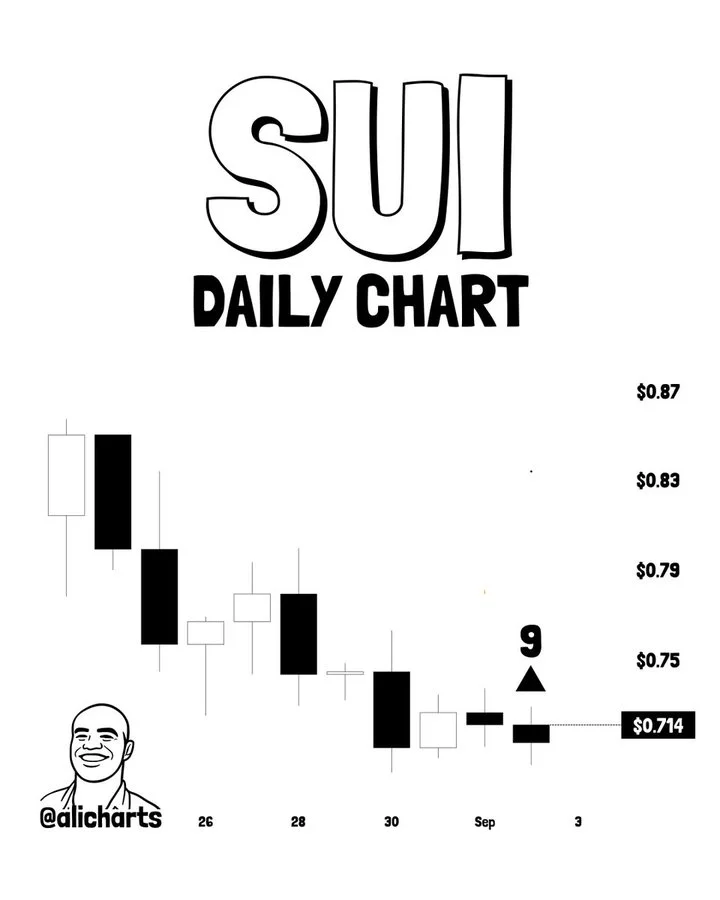
However, it is important to point out that a recovery could be achieved through a one- to four-candlestick structure. It all depends on how price evolves following the completion of the first move.
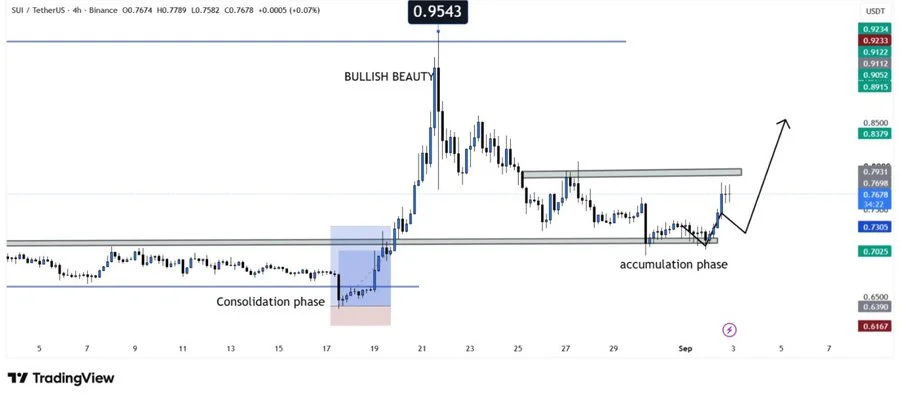
In addition, another analyst, BitGuru, pointed out that SUI is showing strong accumulation in the range of $0.70 to $0.73. If this support is defended, the price of the SUI may climb to the target of $0.79 and possibly even $0.85 in the future.
The breakdown of the area of accumulation will result in the weakening of the current recovery formation on the daily time frame. Volume and the breakthrough of the resistance levels are still needed for stronger confirmation.
SUI RSI Holds Above Neutral as MACD Pressure Continues
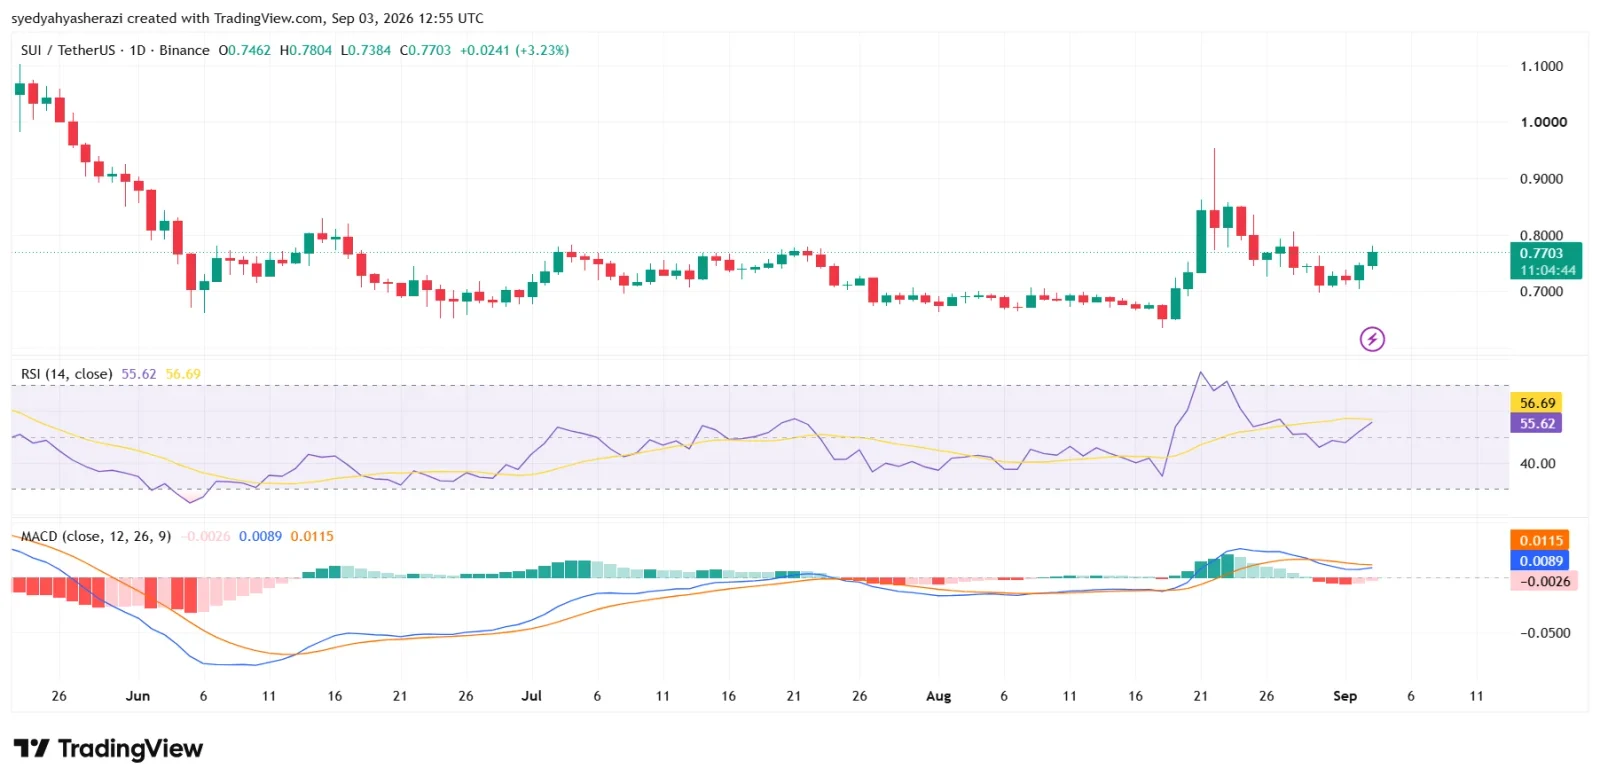
According to TradingView, the Relative Strength Index (RSI) is at 55.62, below the level of its moving average of 56.69. The index stayed higher than the 50 neutral level and lower than the level of overbought conditions of 70.
The Moving Average Convergence Divergence (MACD) line is at the level of 0.0089, below the signal line of 0.0115. The histogram showed a negative value of -0.0026, indicating continued short-term bearish pressure on the daily chart.
What Kravata Sui Integration Offers
Beyond price action, Kravata, a regulated stablecoin protocol, has released its payments infrastructure on Sui. The Latin American firm made the announcement on September 2, 2026.
The integration allows Kravata’s estimated five million customers to make use of stablecoin transactions, payments, and integrated global wallets. All of these features carry zero gas fees.
Sui’s official account shared the development on September 2. It said transactions can be settled within a few seconds using Kravata’s technology on the blockchain.
The integration adds a regional payment use case for SUI as the price attempts to sustain its recovery. Traders will monitor support, trading volume, and resistance for further SUI price direction.
Also Read: Nvidia CEO Issues Powerful Claim: AGI Is Here At G20 2026
This article contains market analysis and price predictions. These are not guarantees. Crypto markets are volatile. Always DYOR. Not financial advice.



Be the first to comment