


Bitcoin price fell below $79,000 on Sept. 8 as weakening capital flows and nearby liquidation clusters increased the risk of a deeper pullback toward $76,000.
Summary
- Bitcoin price traded near $78,450 after failing to hold the former $79,500 support area.
- 4-hour CMF fell to -0.10, showing that selling pressure outweighed buying activity.
- The daily chart kept a bullish structure above the 20-, 50-, 100-, and 200-day averages.
- Liquidation clusters near $78,000 and $80,600 could shape Bitcoin’s next short-term move.
Bitcoin price falls below $79,000
According to data from crypto.news, Bitcoin (BTC) price traded at approximately $78,450 at the time of writing, down around 1% over the previous 24 hours. The decline followed another failed attempt to extend above $80,000, with sellers defending the broader $81,000–$82,000 resistance zone.

The 4-hour chart shows that BTC reached an intraday high near $78,995 before falling as low as $78,281. Price remained slightly above the Supertrend level at $78,204, making the indicator an immediate test for buyers.
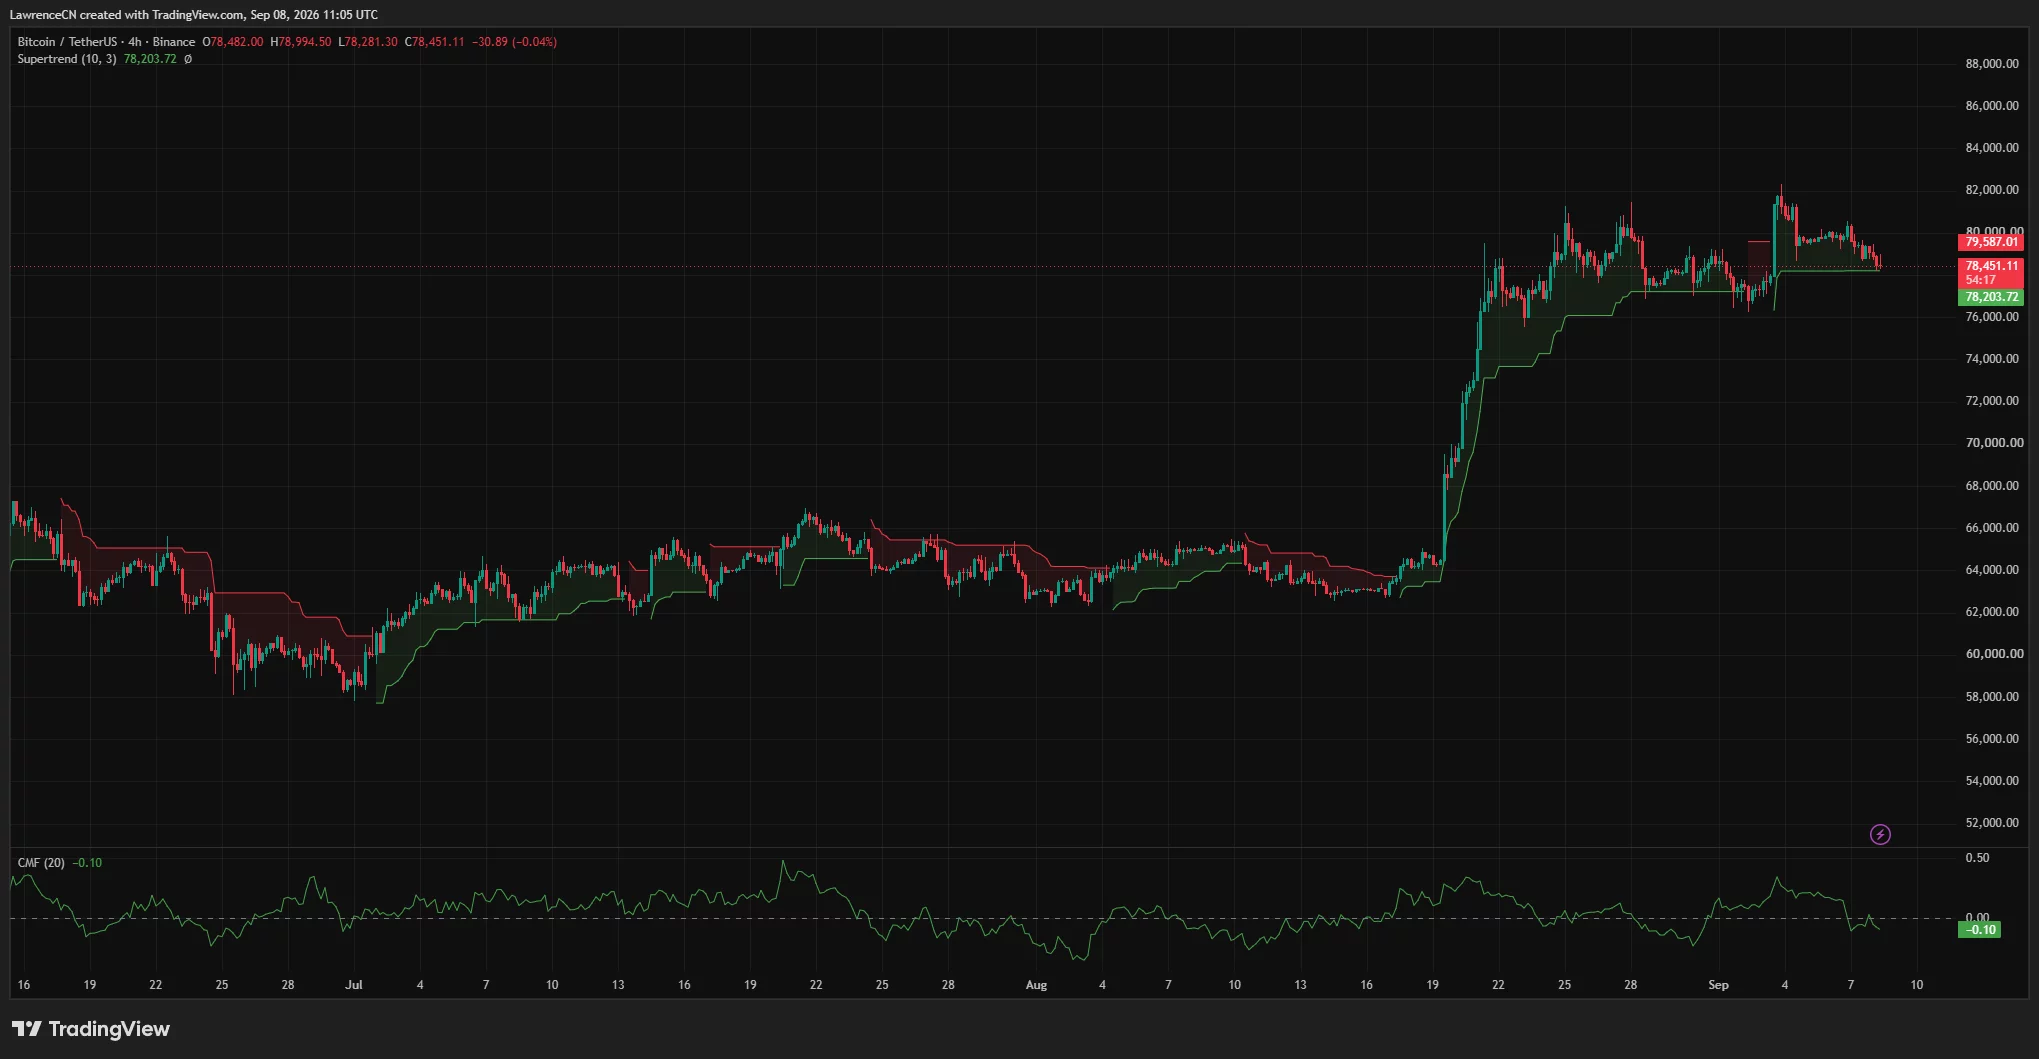
Bitcoin’s Chaikin Money Flow reading fell to -0.10 on the same timeframe. A negative CMF indicates that more capital is leaving the asset than entering it, supporting the loss of short-term momentum.
The pullback also turned the former $79,500 support area into resistance, according to analyst Crypto with Haris B. The analyst said the $78,000 level was showing signs of weakness and identified $76,000 as the next local target if that floor fails.
Daily trend remains bullish above key moving averages
Despite the short-term decline, Bitcoin continued to trade above all four moving averages shown on the daily chart. The 20-day simple moving average stood at $78,440, placing BTC almost directly on its nearest dynamic support.
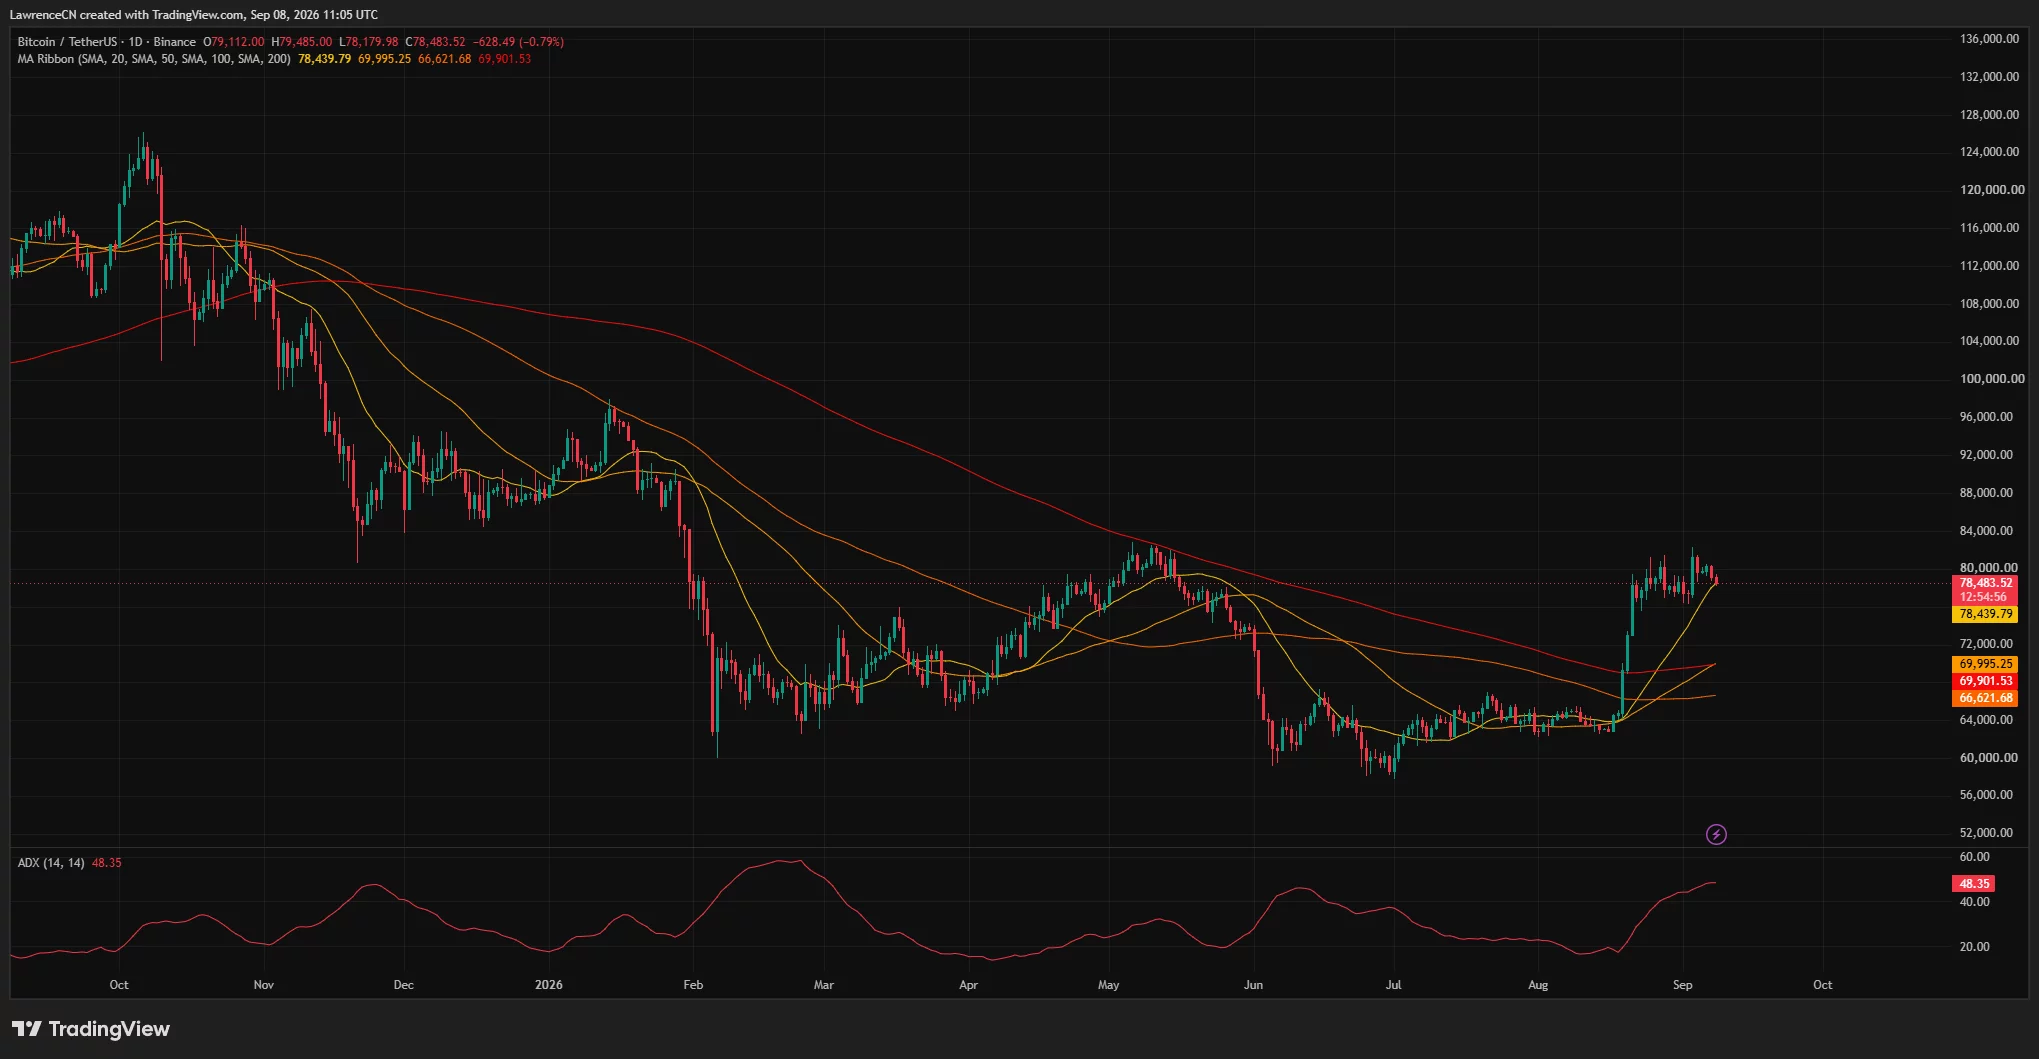
The 50-day SMA was near $69,995, while the 200-day SMA and 100-day SMA stood at approximately $69,902 and $66,622, respectively. The arrangement places the shorter average above the longer averages, a structure normally associated with a broader uptrend.
Bitcoin’s average directional index was 48.35. An ADX reading above 25 points to a strong underlying trend, although the indicator does not determine whether that trend will move upward or downward.
The daily chart also shows that BTC has consolidated between roughly $76,000 and $82,300 since its sharp August advance. A break from either side of that range may decide whether the rally continues or develops into a wider correction.
Dami-Defi described the current decline as a pullback within an uptrend because BTC remained above a rising 4-hour trendline. According to the analyst, a 4-hour close below that trendline would weaken the setup, while a break above $81,000–$82,000 could restart the advance.
Bitcoin liquidation map puts $78K in focus
CoinGlass’ three-day Bitcoin liquidation heatmap shows a bright concentration of leveraged positions close to $78,000. The price was approaching that liquidity band at the time captured by the chart, making it the most immediate downside area to watch.
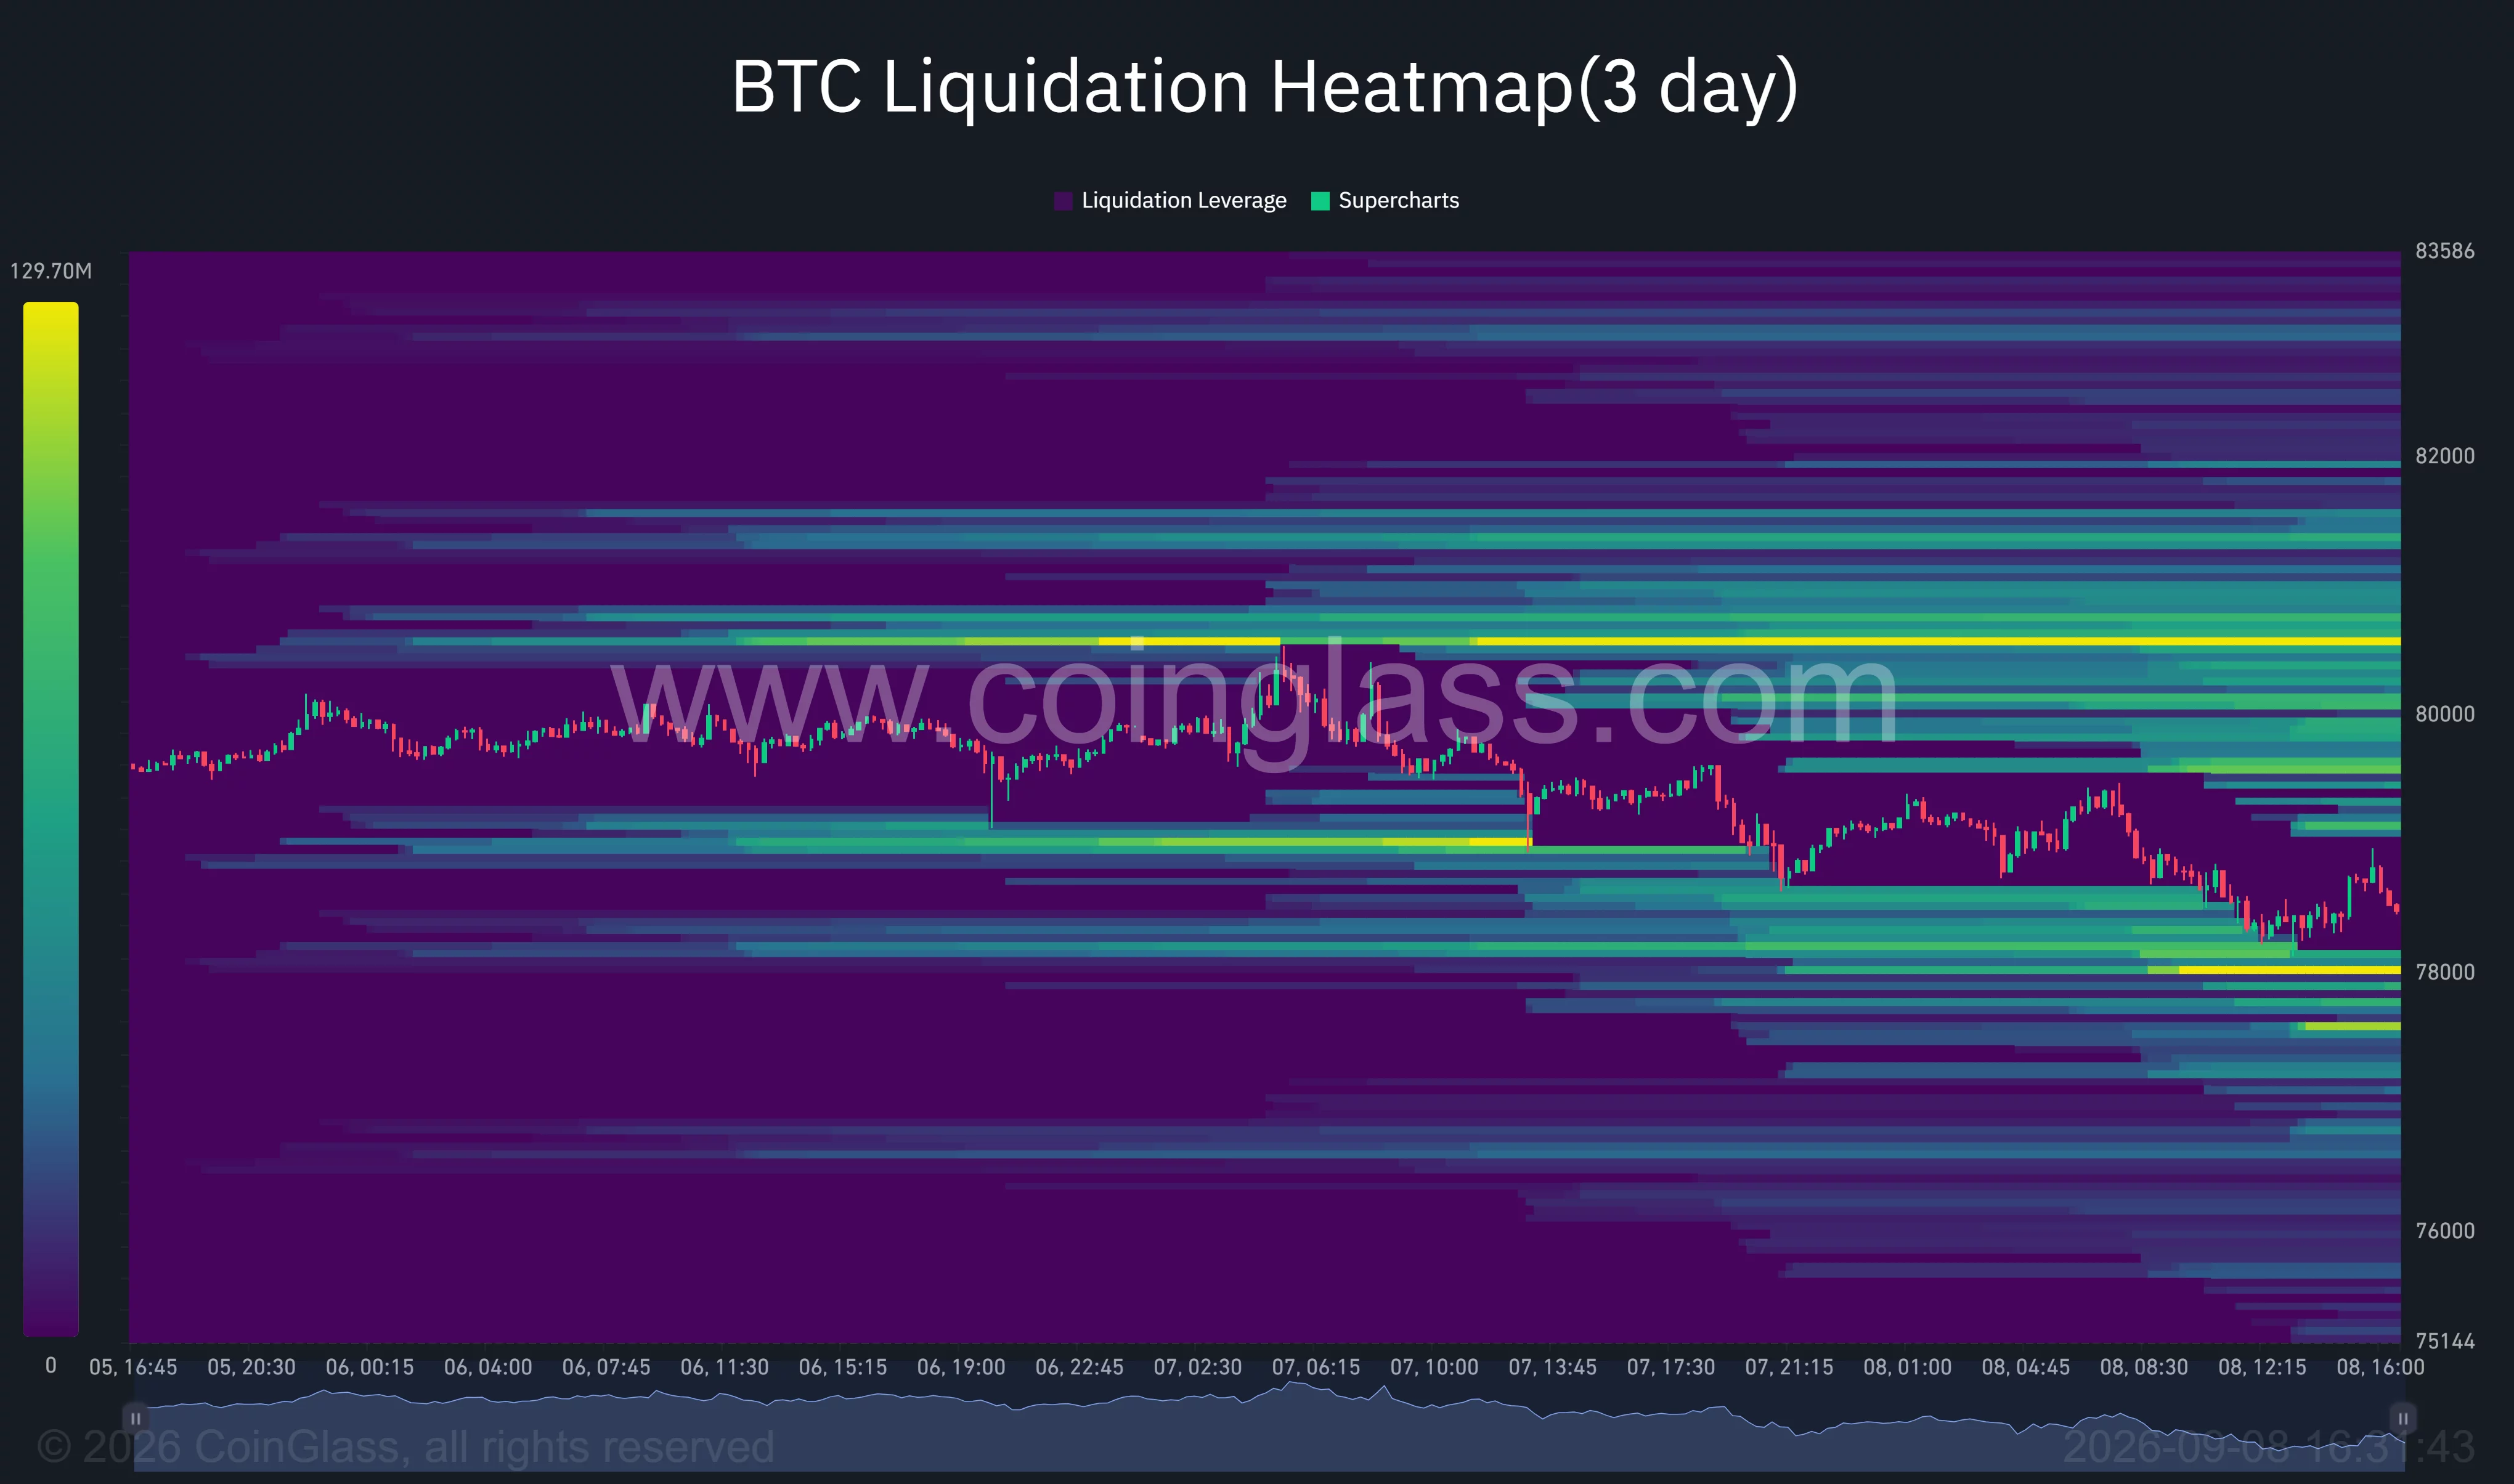
A decline through the cluster could trigger forced closures of leveraged long positions and expose lower liquidity around $77,500. Beneath that zone, the supplied charts place the next important technical support near $76,000.
Larger liquidation concentrations sit above the market. The strongest visible band is around $80,500–$80,700, with additional liquidity between $81,000 and $82,000.
Price can move toward areas holding large numbers of leveraged positions, although a heatmap does not predict which cluster will be reached first. Bitcoin therefore remains caught between nearby long liquidations around $78,000 and a larger pool of short liquidations above $80,500.
A recovery above $79,500 would give buyers another opportunity to target the upper clusters. Failure to reclaim that level would keep pressure on the Supertrend and the $78,000 floor.
US jobs data raises pressure before the Fed meeting
The latest decline came as US investors reassessed the interest-rate outlook following stronger labor data. The US Bureau of Labor Statistics reported that nonfarm payrolls increased by 162,000 in August, compared with an average monthly gain of 31,000 over the previous 12 months.
The unemployment rate remained at 4.1%. A resilient labor market can give the Federal Reserve more room to keep borrowing costs elevated, a backdrop that can weigh on non-yielding assets such as Bitcoin.
Inflation also remained above the Fed’s 2% objective. The Bureau of Economic Analysis reported that the PCE price index rose 3.7% year over year in July. August PCE figures have not yet been released and are scheduled for Sept. 30.
Interest-rate traders were assigning an elevated probability to a rate increase at the September meeting, according to CME FedWatch. The Federal Reserve’s next policy meeting is scheduled for Sept. 15–16.
Bitcoin faces $76K risk if $78K breaks
Bitcoin’s immediate outlook depends on whether buyers can protect the $78,000–$78,200 area. Holding that zone would preserve the 4-hour Supertrend and leave room for a recovery toward $79,500, followed by $80,600 and $82,000.
A decisive 4-hour close below $78,000 would weaken the higher-low structure identified by Dami-Defi. Such a move could send BTC toward $77,000 and $76,000, where the recent range offers the next visible support.
The daily moving averages still support the broader bullish case, but negative CMF and resistance at $79,500 favor caution in the near term. A close above $82,300 would invalidate the current range and confirm a fresh breakout, while a loss of $76,000 would raise the risk of a wider retracement.
Disclosure: This article does not represent investment advice. The content and materials featured on this page are for educational purposes only.



Be the first to comment