



HBAR price is showing an early recovery after a sharp pullback earlier in September. The token fell from around $0.082 on September 7 to a low near $0.072 on September 16 before buyers stepped in. Since then, HBAR has recovered toward the $0.077 area, putting the token back near levels that could determine whether the rebound develops into a larger move.
The technical setup is also drawing attention. Crypto analyst Jesse Olson recently highlighted HBAR’s daily chart, pointing to a bullish divergence followed by a higher low. His analysis indicates that HBAR retraced into a key target area and appeared to find support there.
This is important, as an increase in the level of the lows in the face of falling prices may mean that the selling activity is beginning to fade away. Nevertheless, further confirmation will only come if HBAR manages to break through the resistance levels.
As of the time of writing, HBAR is currently trading at approximately $0.077, having made an intraday high at $0.0781 on September 18. HBAR is thus trying to bounce back from its recent weakness.

HBAR Price Structure Shows Buyers Defending Support
Price movements over the past period have brought out a clear short-term pattern for HBAR. HBAR finished the trading session on September 17 around the level of $0.0747 after trading within the range of $0.0734 to $0.0766. On September 18, HBAR rose to about $0.0781.
This is important considering that HBAR previously fell from $0.0799 to $0.0720 on September 16 from September 15. This fall led to the formation of the current support zone, which has attracted attention from Olson on the daily chart.
Technically speaking, the most important thing at the moment is the $0.078 to $0.080 zone. This is because previously HBAR encountered selling pressure at $0.0798 on September 15.
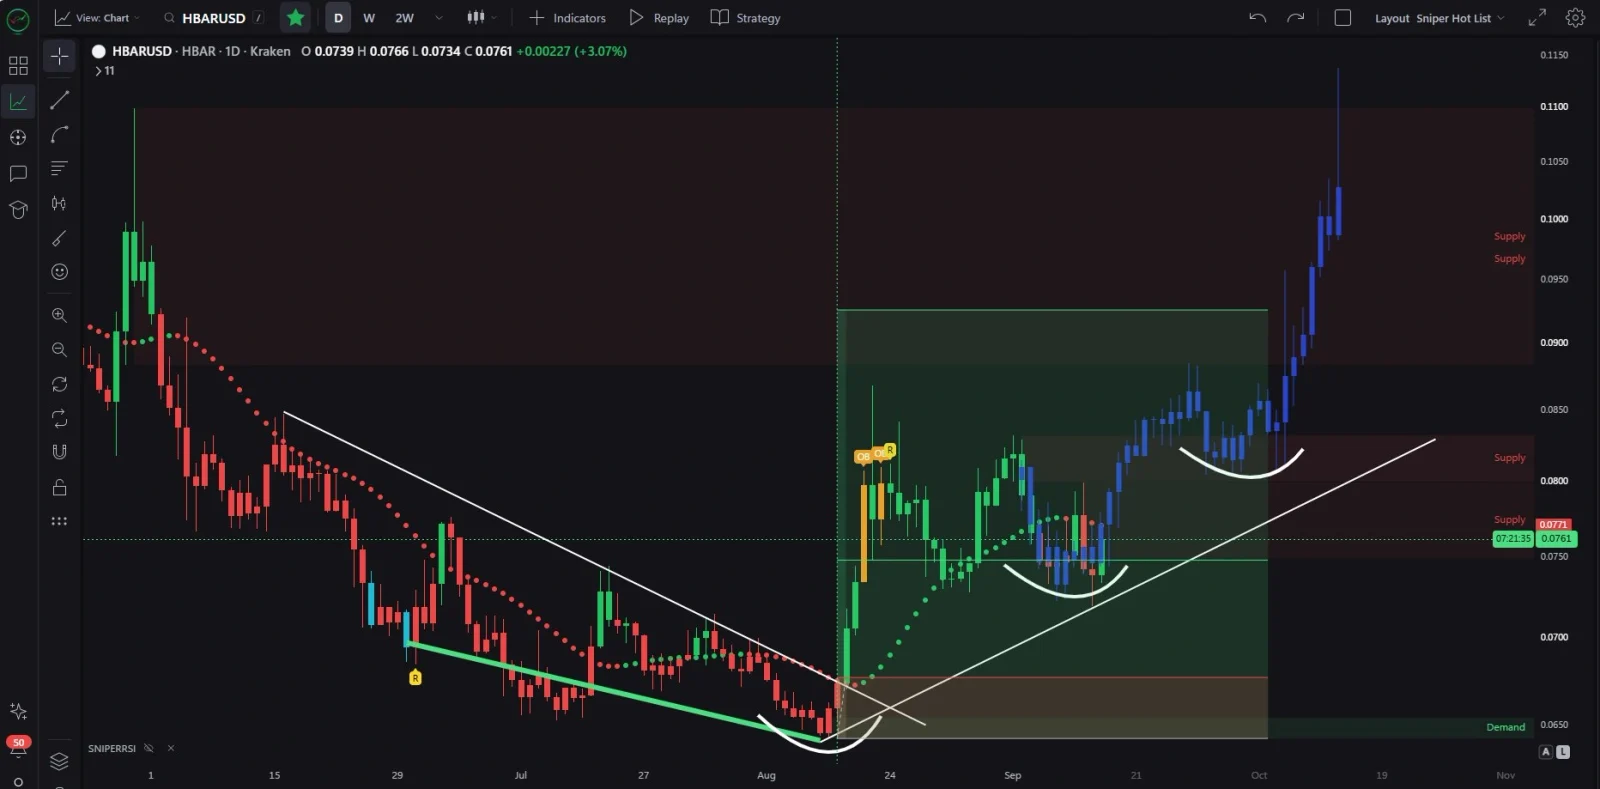
Source: Analyst Jesse Olson X Post
A break and close above that level will help the short-term setup, as it would allow the creation of a higher high after a higher low seen earlier. If unable to break resistance, HBAR might consolidate or test lower levels.
The $0.074-$0.072 region has become highly important on the downside now. The HBAR has been tested at those levels several times recently, and the low of September 16 around $0.072 helps to set a target for the defense of the recovery.
Also Read: HBAR Price Eyes a Move Toward $0.20 as Hedera RWA Growth Supports Bulls
Hedera Expands Community Activity Across More Regions
The technical setup is developing alongside continued expansion across the Hedera ecosystem.
In its recent community update, Hedera announced its activity in Mexico, Colombia, Argentina, Brazil, and Spain, and the start of the next phase of its Ambassador Program. This expansion will first target North America and Africa, including such countries as the US, Canada, Nigeria, and Kenya.
The official Hedera Ambassador Program is meant to assist developers, community leaders, and advocates by providing educational efforts, content production, hosting events, community outreach activities, and ecosystem development. Currently, this program claims that the network operates in North America, Latin America, Africa, and Asia.

Source: Hadera
This makes yet another addition to the wider ecosystem growth of Hedera. According to their report, the network’s ambassadors helped organize local meet-ups in Colombia, Brazil, Mexico, and Argentina in Q1 of 2026, attracting over 200 new community members to their activities.
Hedera has further continued adding partners to its ecosystem. WISeKey was announced as the new Strategic Partner on September 4, and SpaceDev became a new Community Partner, with SpaceDev set to expand Hedera’s influence in Latin America.
It is important to note that these activities do not directly lead to increased demand for HBAR tokens. Nevertheless, increased developer involvement and regional communities can bring more attention to the network and provide opportunities for interactions with Hedera.
What happens next for HBAR Price?
The subsequent move for HBAR might be determined by how the current rally evolves to become a reversal of its short-term price structure.
The close proximity to $0.078-$0.080 is noteworthy due to the convergence of the September high values. A break and subsequent consolidation above this range would support the recovery pattern established by Olson. On the other hand, a rejection near the resistance will result in another retreat to the support region of $0.074-$0.072.
It is essential to note that the trend is equally significant. As HBAR is still trading below the previous September’s highs, this rally must be treated as a recovery effort and not a reversal one.
However, the growing number of ambassadors and recent ecosystem alliances for Hedera should be considered as another couple of basic developments. In case the expansion of the community brings more developer activity and network usage, it might become another aspect that will affect the future demand for HBAR.
For the time being, HBAR’s bull diverging pattern, along with its higher low and support near the recent $0.072 level, makes it technically prepared for a bounce, with the $0.078-$0.080 level being tested in the further price action.
Also Read: HBAR Price Eyes Rally Toward $0.26 Hedera Expands AI Integration
This article contains market analysis and price predictions. These are not guarantees. Crypto markets are volatile. Always DYOR. Not financial advice.


Be the first to comment