



The Bitcoin price is only a matter of $1,000 or so from surpassing a key macro high that would be a huge step towards changing the macro trend from bearish to bullish. Could the price explode to the upside once this higher high is achieved?
$BTC price moves up out of parallel channel
Source: TradingView

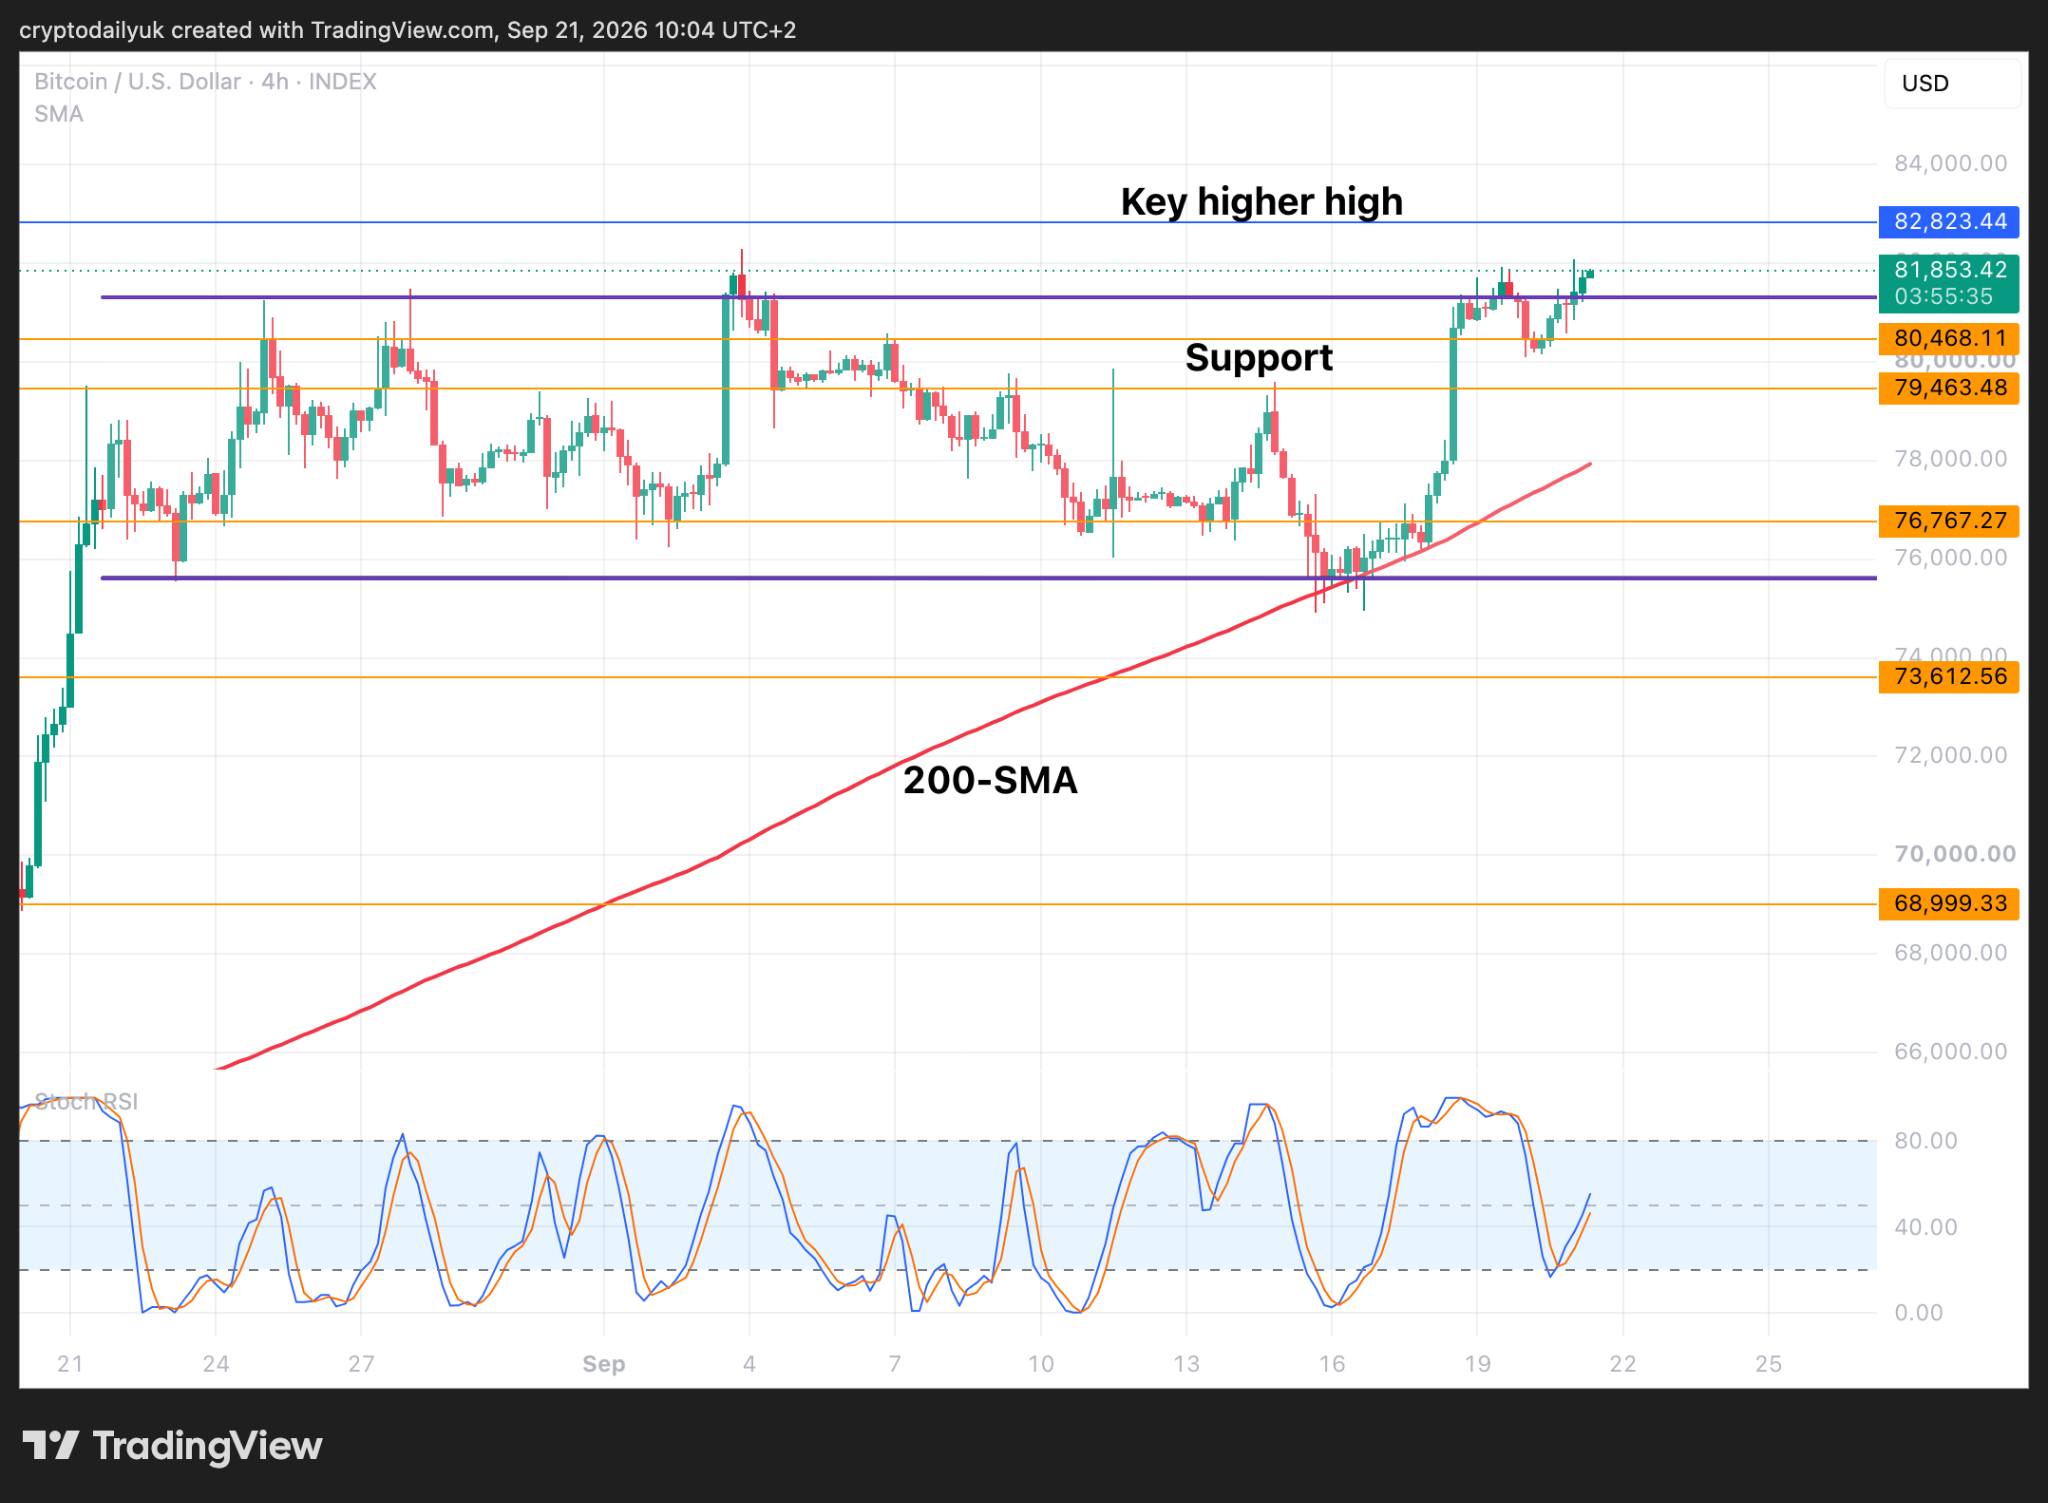
The short-term 4-hour chart reveals that the $BTC price is creeping steadily towards the prize of that key higher high at around $82,820. The price has left the top of the parallel channel, and this time around, there looks to be plenty of momentum to take the price past that key higher high.
Even just taking into account the measured move out of the channel, this would take the $BTC price to $87,000 should it completely play out. We also have no little matter of a bull flag, the measured move of which could take the price up to the wonderful round figure of $100,000.
Breaking the bear market, then ending it
Source: TradingView
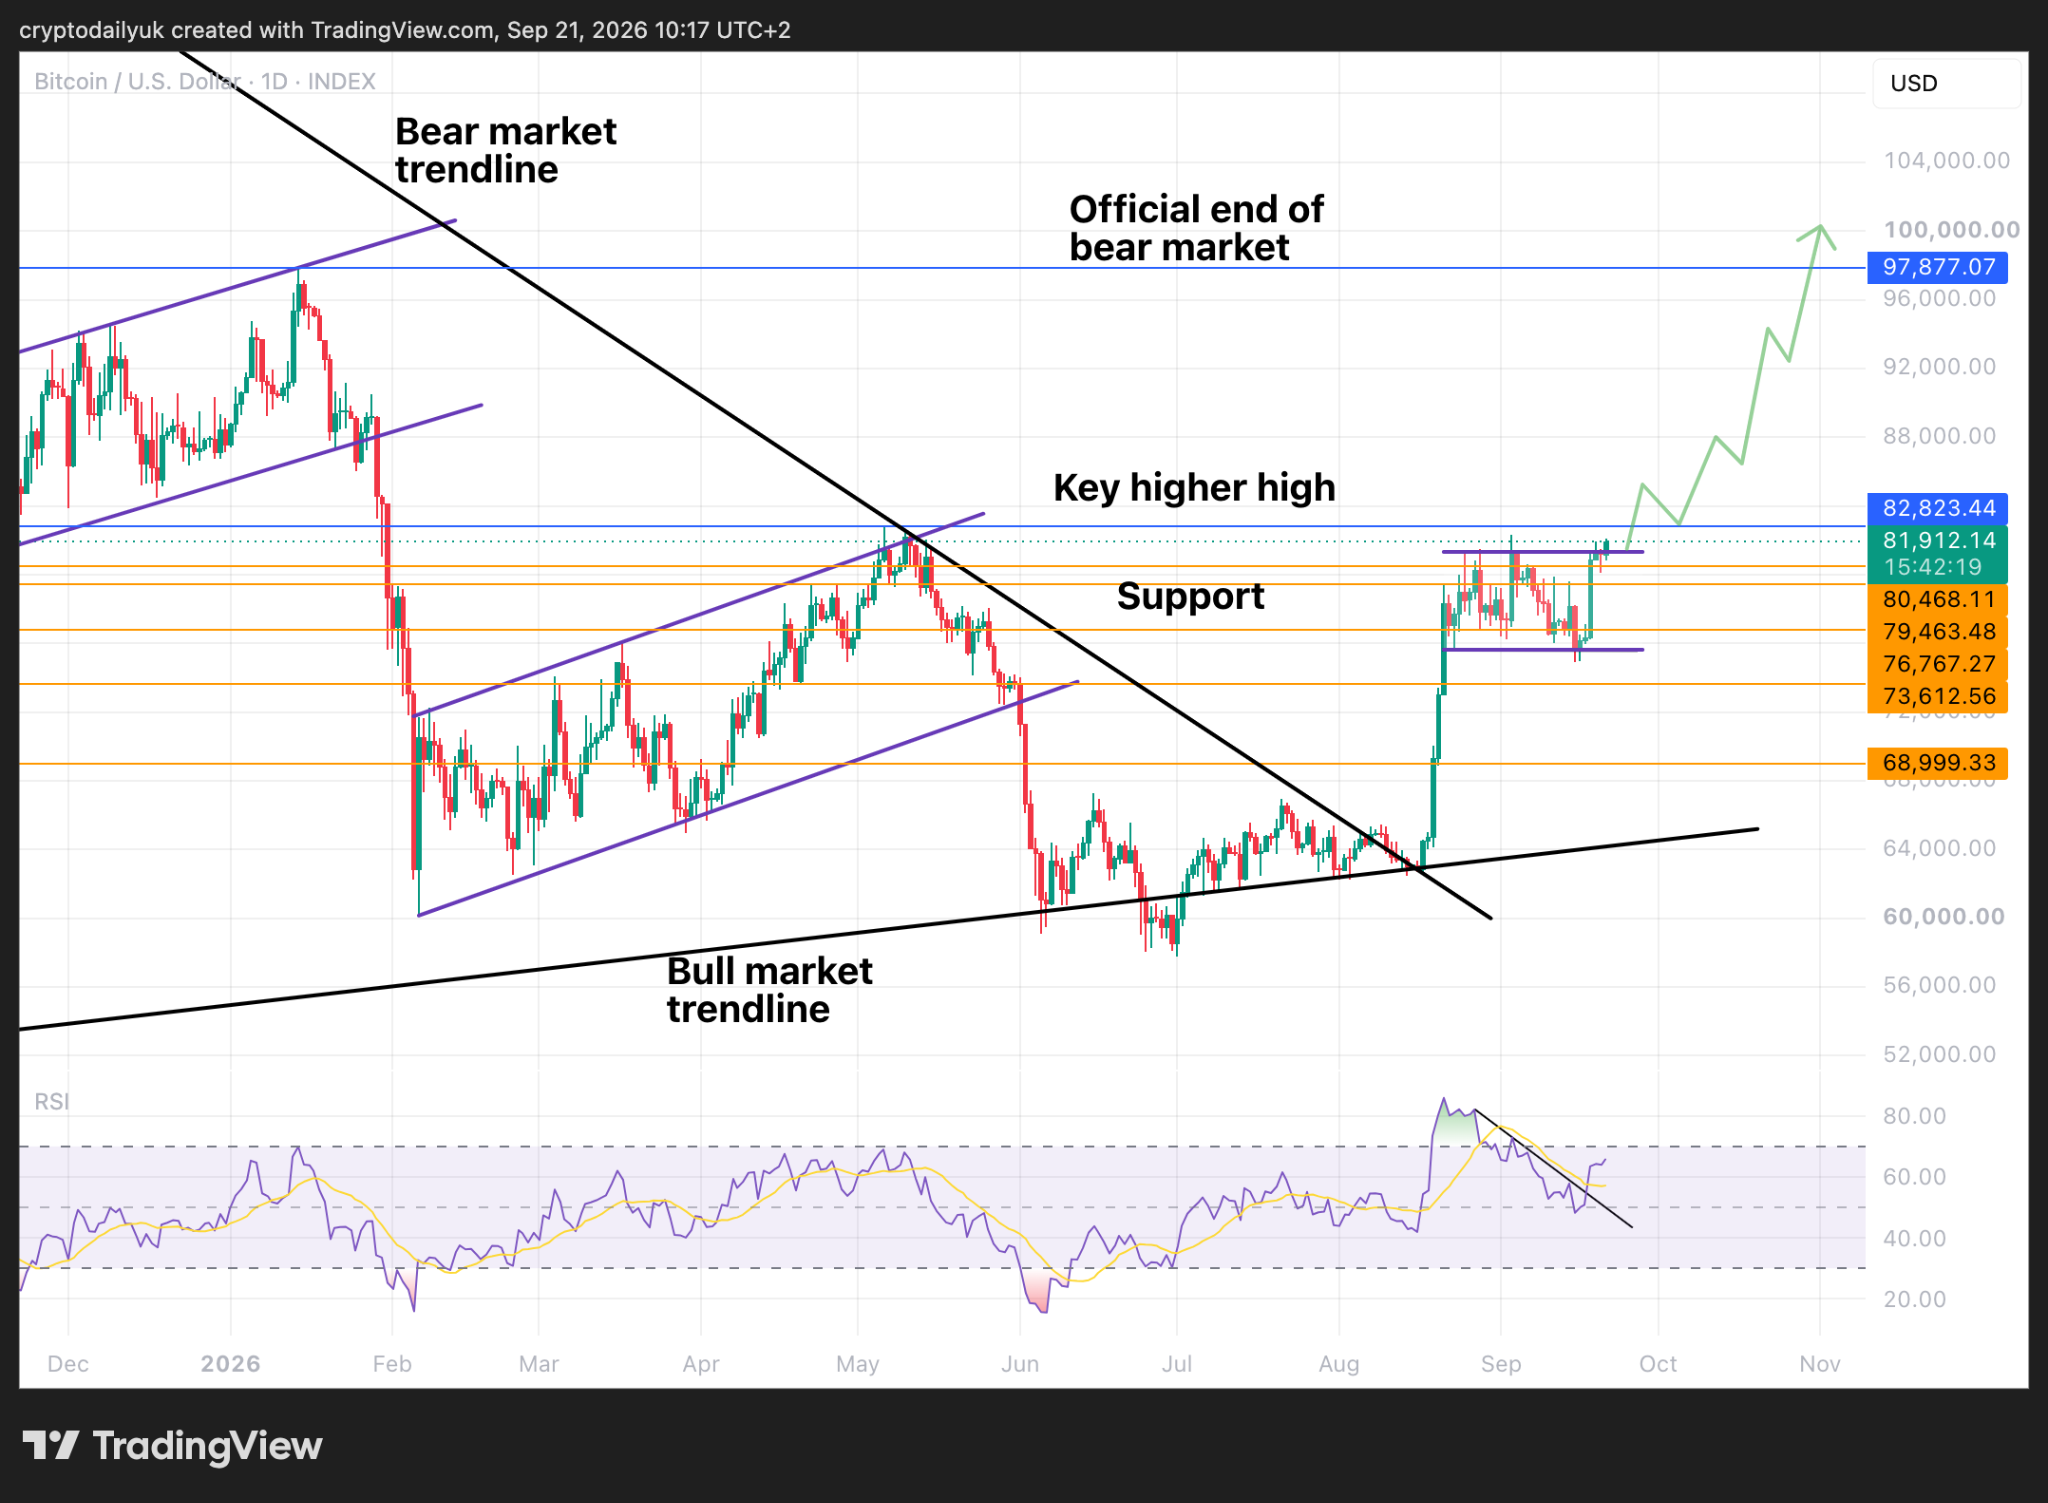
In the daily chart we can see the two big bear flags that accounted for most of the downside in the bear market. The last higher high for each bear flag have now become key targets for this as yet unconfirmed bull market.
The $BTC price is currently approaching the previous bear flag top. If a higher high can be put in here, this could break the back of the bear market. Given that the price is currently issuing from the top of a bull flag, the upside momentum and the measured move could then take the price beyond the next bear flag top – officially ending the bear market and confirming the new.
At the bottom of the chart, the RSI indicator line has crossed up through the small downtrend, signalling that the bulls are back in charge. Look for a break and then a confirmation of the key 70.00 limit, which would mean the price is going higher still.
$BTC price makes key higher high
Source: TradingView
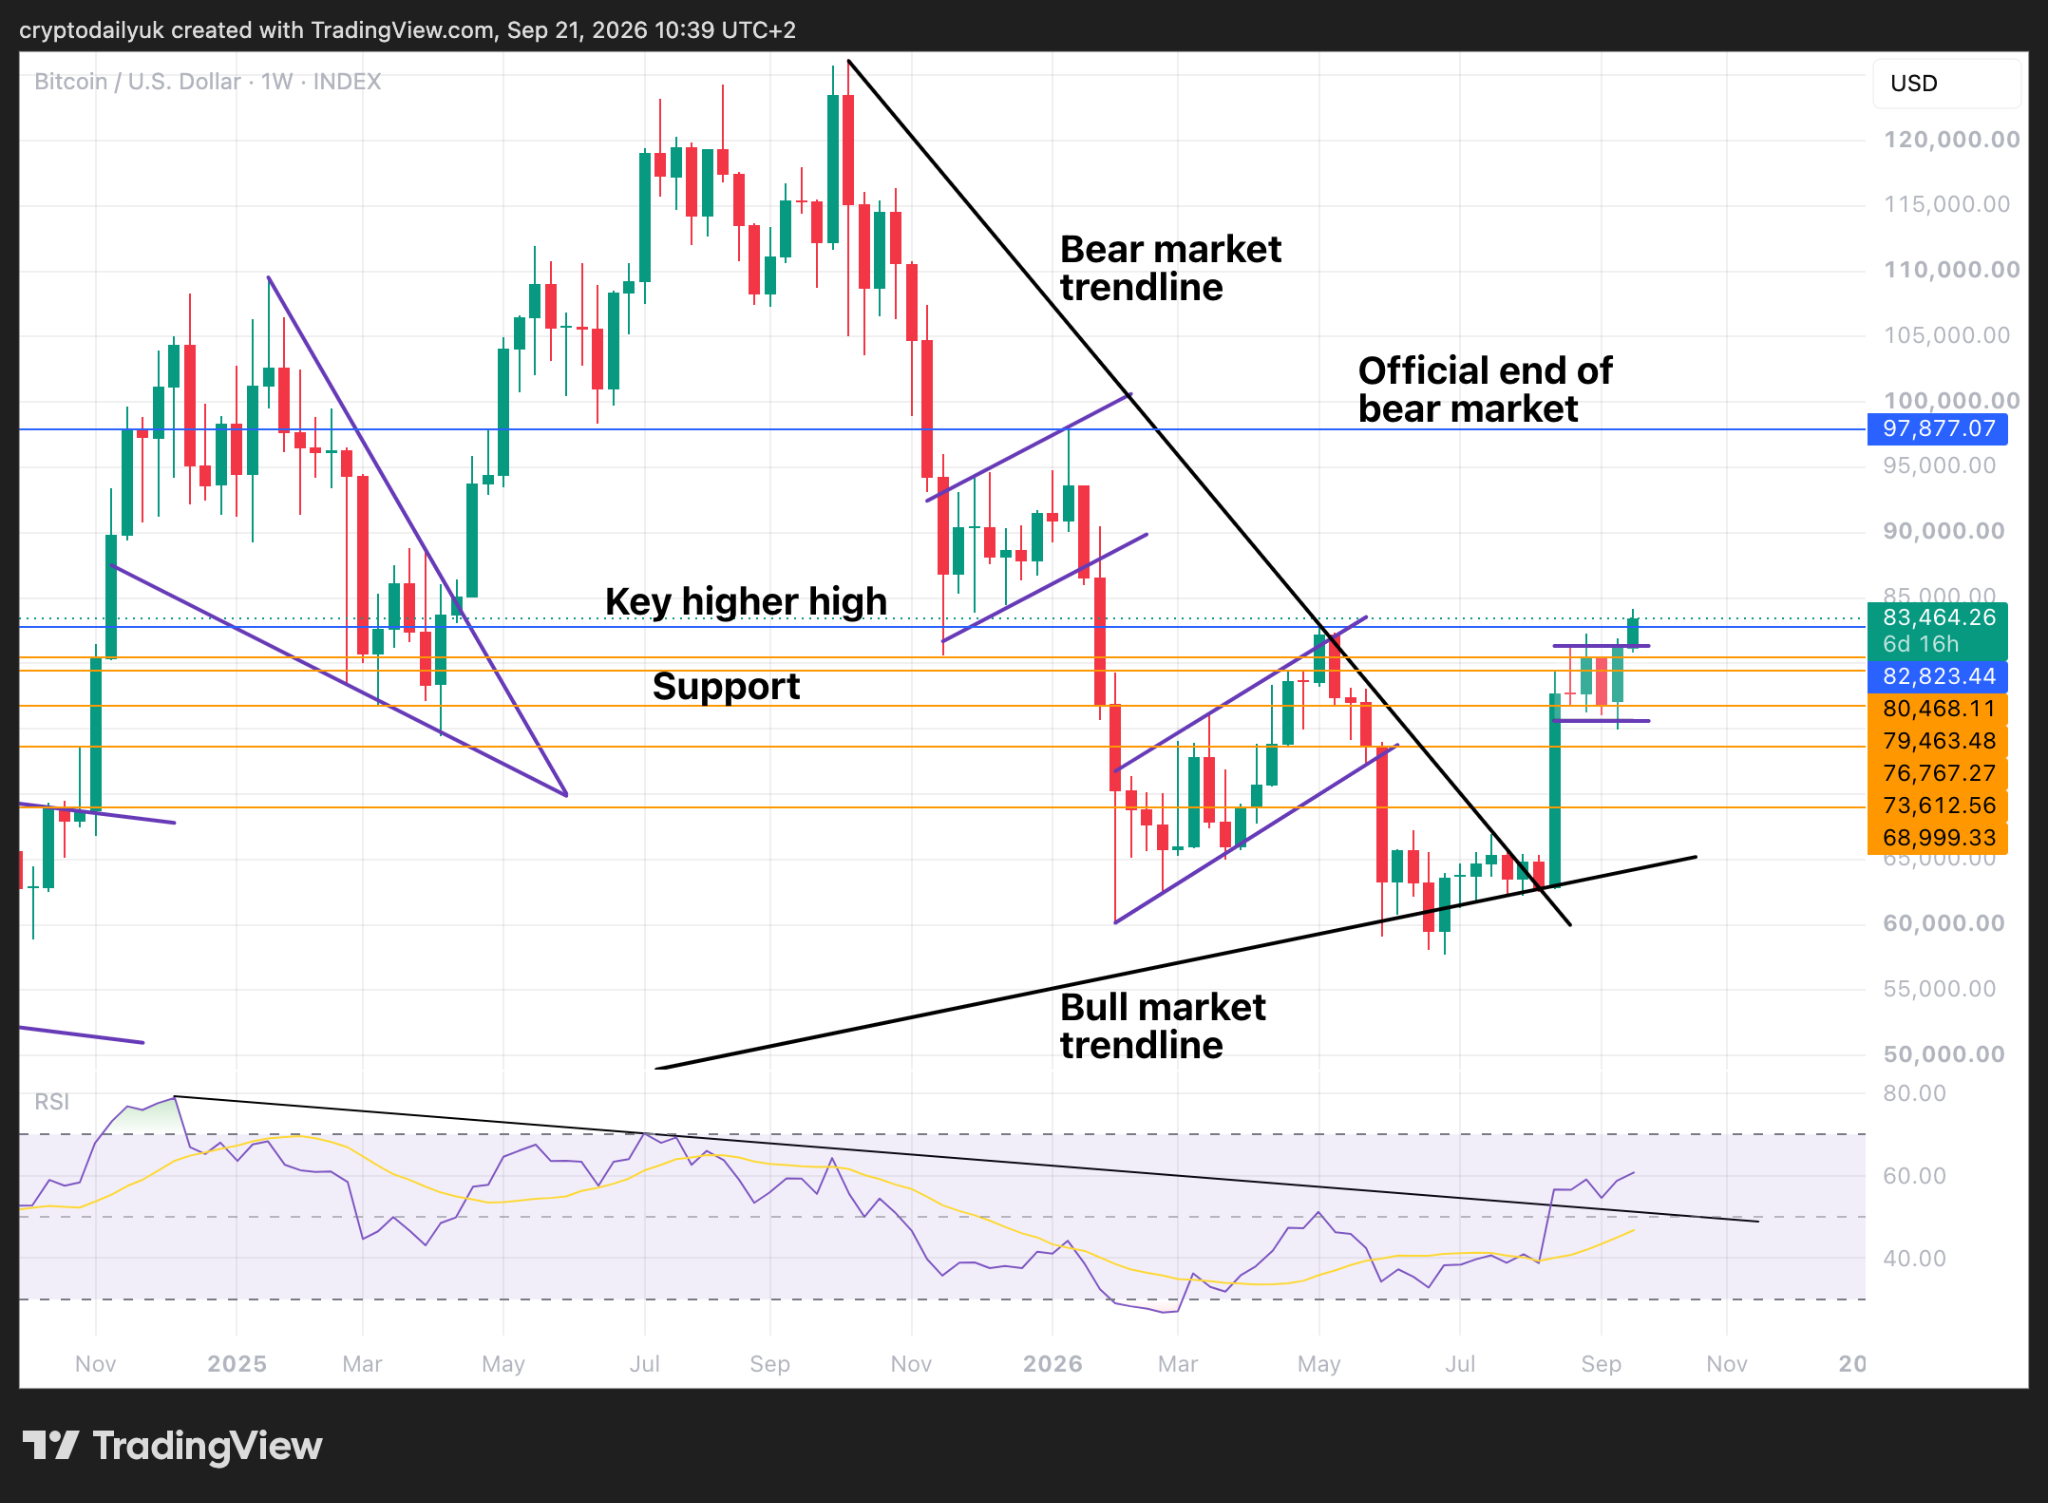
As can be seen in the weekly chart, in the last few minutes the $BTC price shot up and beyond the key higher high, getting to just above $84,000 so far. This is excellent news for the bulls. Depending on the depth of buying interest behind this move, the price will either go to $85K – $87K, with the possibility of $90K, or will come back to test the higher high or perhaps the top of the channel before going higher again.
The bottom of the chart gives another very positive view of the RSI. The indicator line has broken up through a trendline that started back in March 2024. The next step, if the $BTC price is to continue moving up, is to make a higher high. This would entail the indicator line getting above the 70.00 level.
Disclaimer: This article is provided for informational purposes only. It is not offered or intended to be used as legal, tax, investment, financial, or other advice.





Be the first to comment