



The Ethereum price gained fresh momentum on Monday, September 21, 2026, as bullish technical signals and renewed ETF inflows supported the breakout. Rising derivatives activity also strengthened attention around ETH’s outlook.
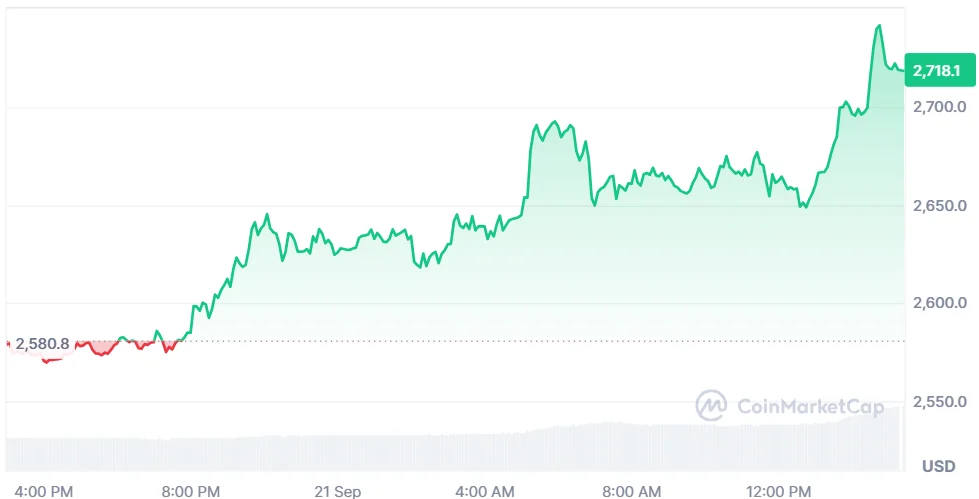
As of writing, Ethereum (ETH) is trading at $2,716.88, showing an uptick of 5.6% in the past day. The trading volume is showing a strong bullish surge up 94.67% and is currently standing at $18.24 billion. Over the last week, the ETH coin price has gone up by 8.03%, according to CoinMarketCap.
Also Read: Ethereum Privacy: Vitalik’s Bold 2026 Roadmap Sparks Hope
What Is Driving Ethereum’s Bullish Structure?
Crypto Patel, a prominent analyst, highlighted that the price action of Ethereum showed an evident bullish change of character on higher timeframes. The cryptocurrency broke out strongly from the $2,300 demand zone and rebounded above the $2,483-$2,584 fair value gap.

The retested fair value gap is the most important reaction level for the time being in the market, according to Patel. The next upside fair value gap is located at $2,715-$2,900, while the next bearish order block and fair value gap can be seen at $3,070-$3,404.
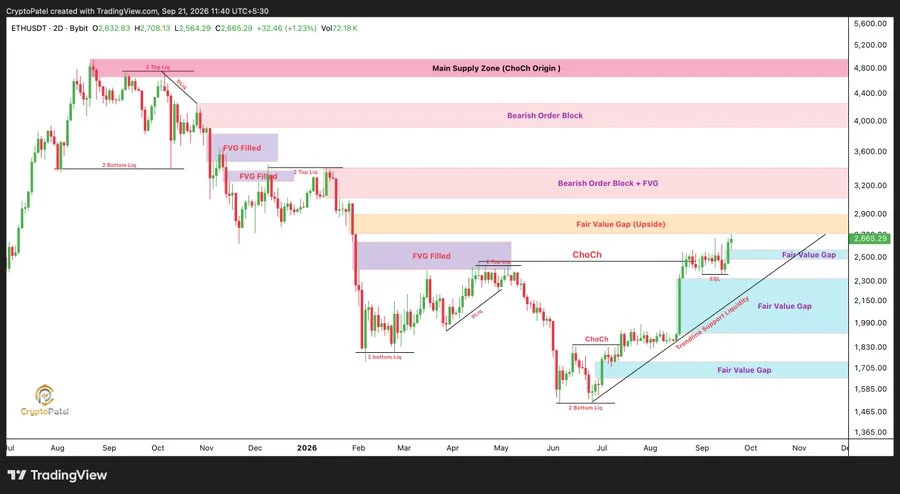
A bullish pattern will still be in play as long as ETH maintains above $2,360. Additionally, the analyst mentioned $2,300 as key support for the trend line and $1,647-$1,744 as additional higher time frame gap in case of failure.
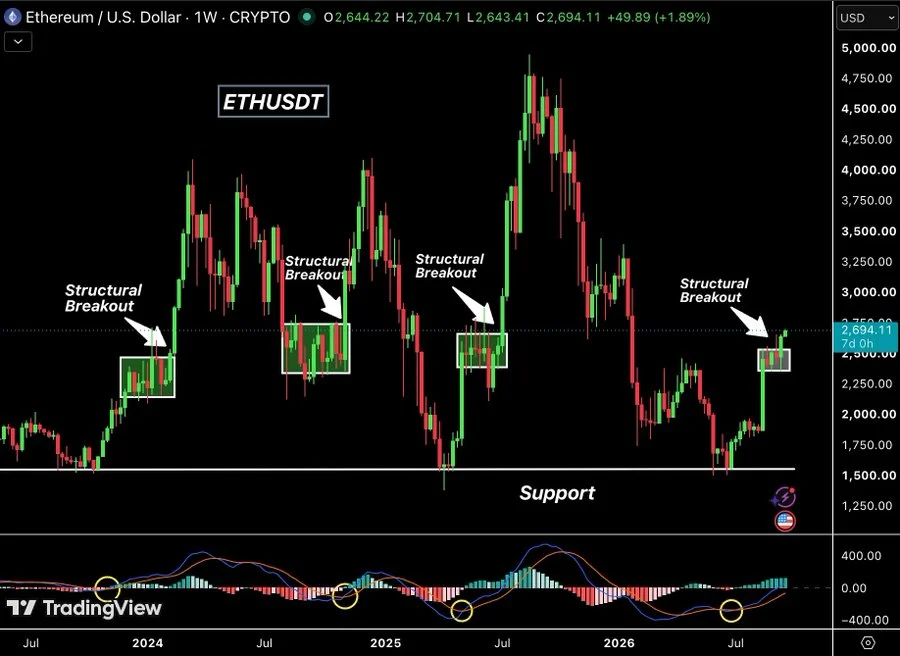
Additionally, another analyst, Ash Crypto, mentioned the possibility of a weekly breakout following the 6.77% gain recorded for ETH at the end of the week. Ash Crypto noted that Ethereum broke out above a consolidation box that came before three earlier breakouts.
Ash Crypto flagged $1,900 and $1,500 as broader support zones for ETH. If the price holds the breakout level, then $3,200-$3,600 can come into play, while a move back below the box could weaken momentum.
Why ETF Flows Matter for Ethereum Price
According to SoSoValue data, US spot Ethereum ETFs were seen accumulating $143.80 million in net inflows on Sept. 18. This development comes after three days of withdrawal worth around $404.82 million over Sept. 15 to Sept. 17.
The net inflow saw a recovery of about 35.5% of the previous three-day withdrawal. The cumulative net inflow stood at $13.25 billion, while the total ETF net asset jumped to $16.72 billion from $15.42 billion on the previous day.
On the other hand, the ETF’s trading value is seen at $1.88 billion compared to $680.47 million on Sept. 17. These developments highlight a comeback in the activity, despite volatility in flows of the month of September.
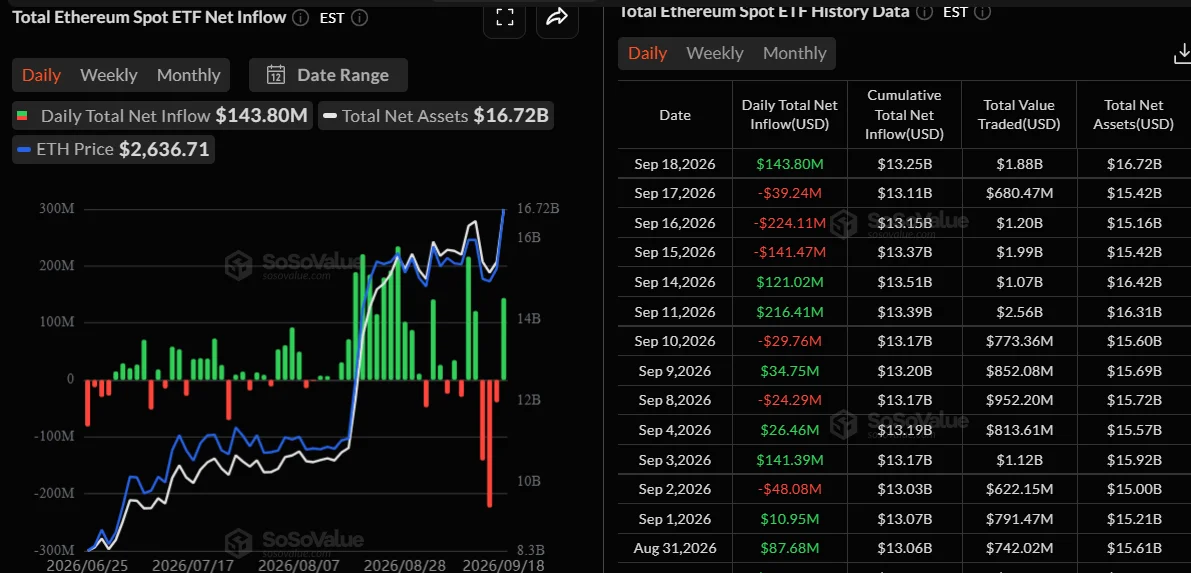
The resumption of positive inflows lends additional backing to the recent price move higher on Ethereum. Nevertheless, one positive day cannot outweigh the substantial withdrawals seen during the past three days of trading.
Where Is Ethereum’s Key Liquidity Concentrated?
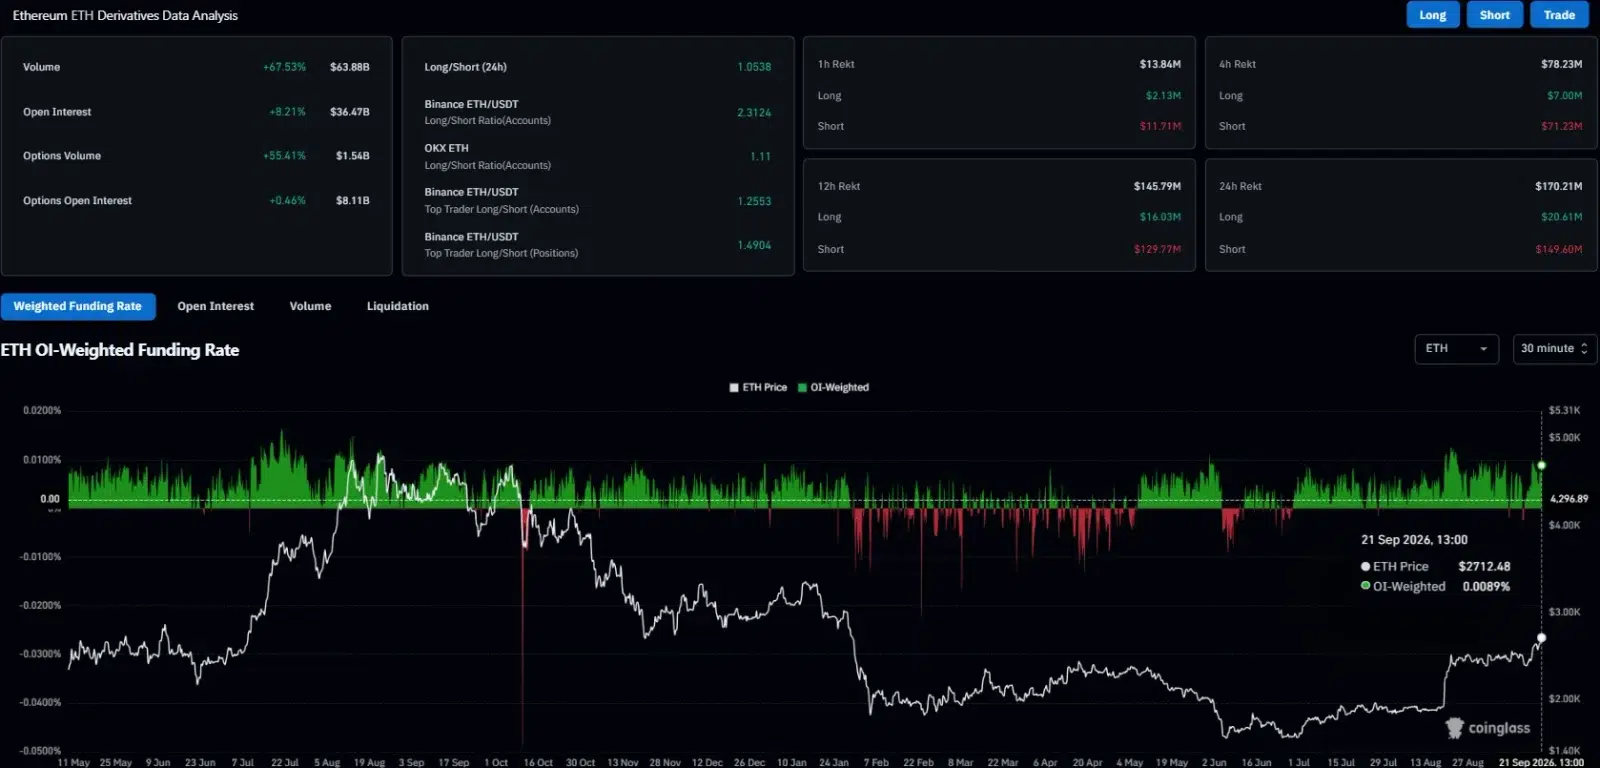
According to CoinGlass data, the future volume has risen by 67.53% to $63.88 billion. Open interest rose by 8.21% to $36.47 billion, and the ETH OI-weighted funding rate stood at 0.0089%.
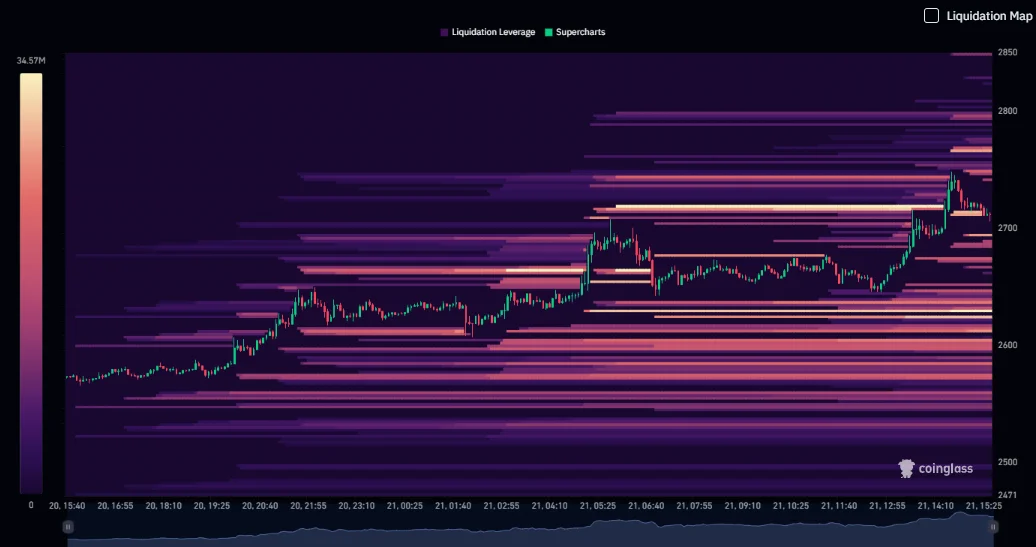
The CoinGlass liquidation heatmap shows that ETH is trading within the $2,700-$2,720 range following a strong intraday move up and pullback. Dense liquidation clusters were visible above the market near the $2,730-$2,800 level, which indicates a significant area of short position pressure.
Rising above $2,750 could see further short liquidations once the price hits the clusters. Below the market, large clusters of liquidity can be seen near the $2,600-$2,660 and $2,550 ranges.
In terms of liquidity, these levels put the Ethereum price in between two significant liquidity clusters on both sides. The nearest upside liquidity cluster is visible near the $2,800 level, whereas the downside cluster remains relevant near $2,600.
What Do Ethereum’s Technical Indicators Show?
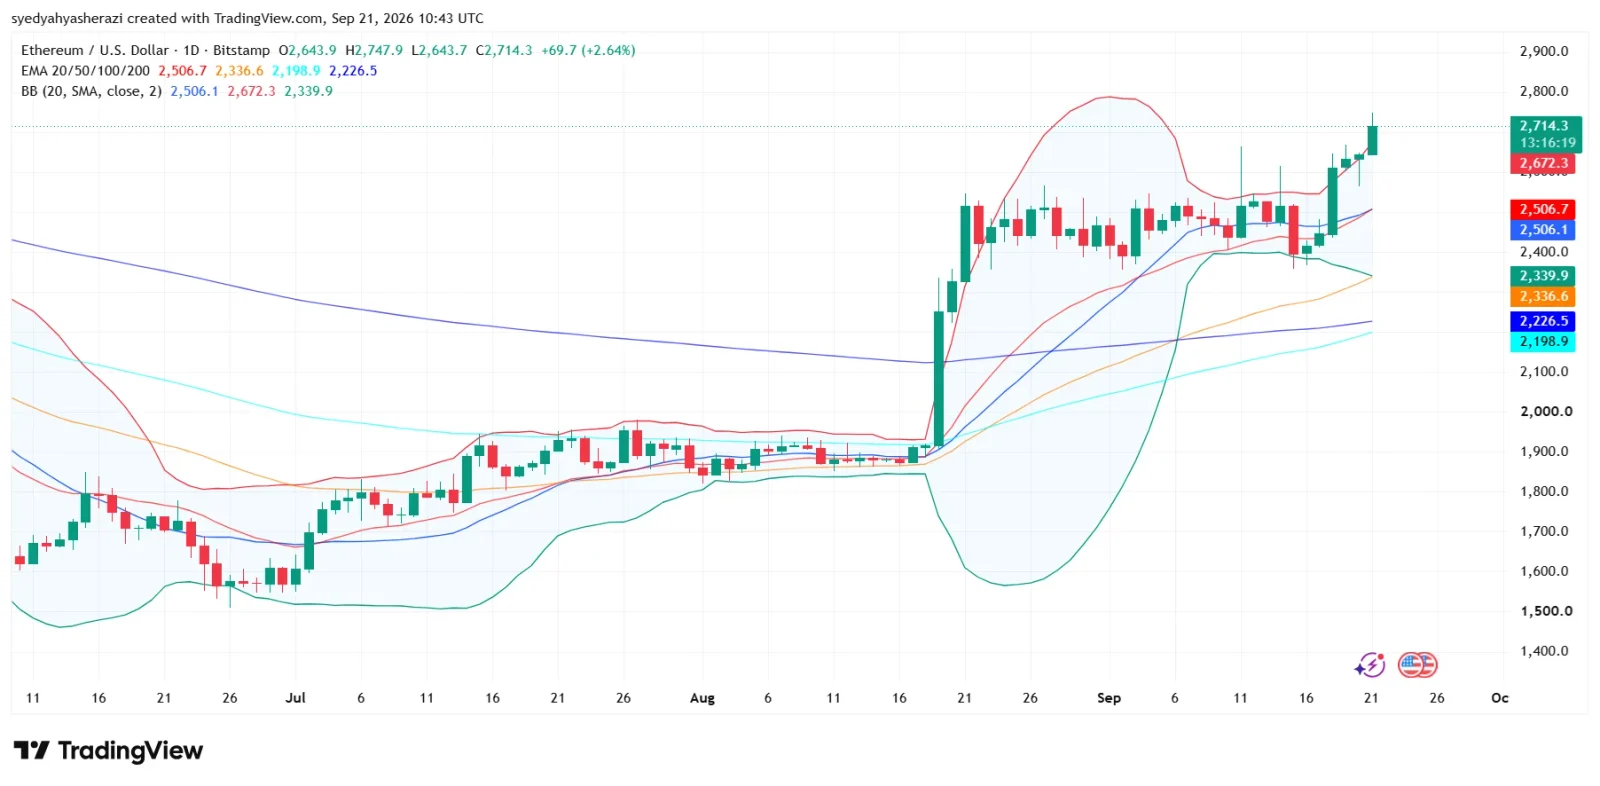
According to TradingView data, ETH is at $2,714.3, which is higher than the 20-day EMA of $2,506.7 and the 50-day EMA of $2,336.6. The 20-day average is also above the 50-day average, meaning that momentum is bullish both in the short term and in the medium term.
ETH is above the 100-day EMA at $2,198.9 and the 200-day EMA at $2,226.5. The current ETH price is significantly higher than all four of the moving averages shown on the daily chart.
The Bollinger Band (BB) shows the midline at $2,506.1, the upper band at $2,672.3, and the lower band at $2,339.9. The ETH trades beyond the upper band level, indicating robust momentum along with increased volatility.
Currently, the attention will be on the upside $2,715-$2,900 range pointed out by Crypto Patel. Breaking out of the range will expose the $3,070-$3,404 resistance range, while any failure will bring the attention to $2,584, $2,483, and $2,360.
For the Ethereum price, the following confirmation will be seen through the ETH reaction to those support and liquidity areas. ETF flows, derivative positions, and the recovered technical area will provide the clear market signals in the coming sessions.
Also Read: Ethereum Price Analysis: Can ETH Hold $2,560 Support After Breakout?
This article contains market analysis and price predictions. These are not guarantees. Crypto markets are volatile. Always DYOR. Not financial advice.



Be the first to comment