



The Bonk [BONK] memecoin started the day with a rally, gaining 14% in the market and setting a new local high.
This outlook is bullish, especially considering the fact that there’s been a broader pullback of capital in the crypto market, with Bitcoin falling to the $85,000 region after clinching past $87,000 on the 22nd of September.
For BONK, several factors are worth analyzing to determine if the asset is likely to maintain its bullish run in the near term or if there are obstacles that could delay any potential price gains.
BONK breaks out of its downtrend
BONK’s recent rally started after it breached a descending resistance channel on the chart that guided price lower for multiple weeks.

While that is bullish on a broader scale, the asset’s rally has now been impeded by a horizontal resistance line marked in blue that has prevented the price from trending higher on two separate occasions.
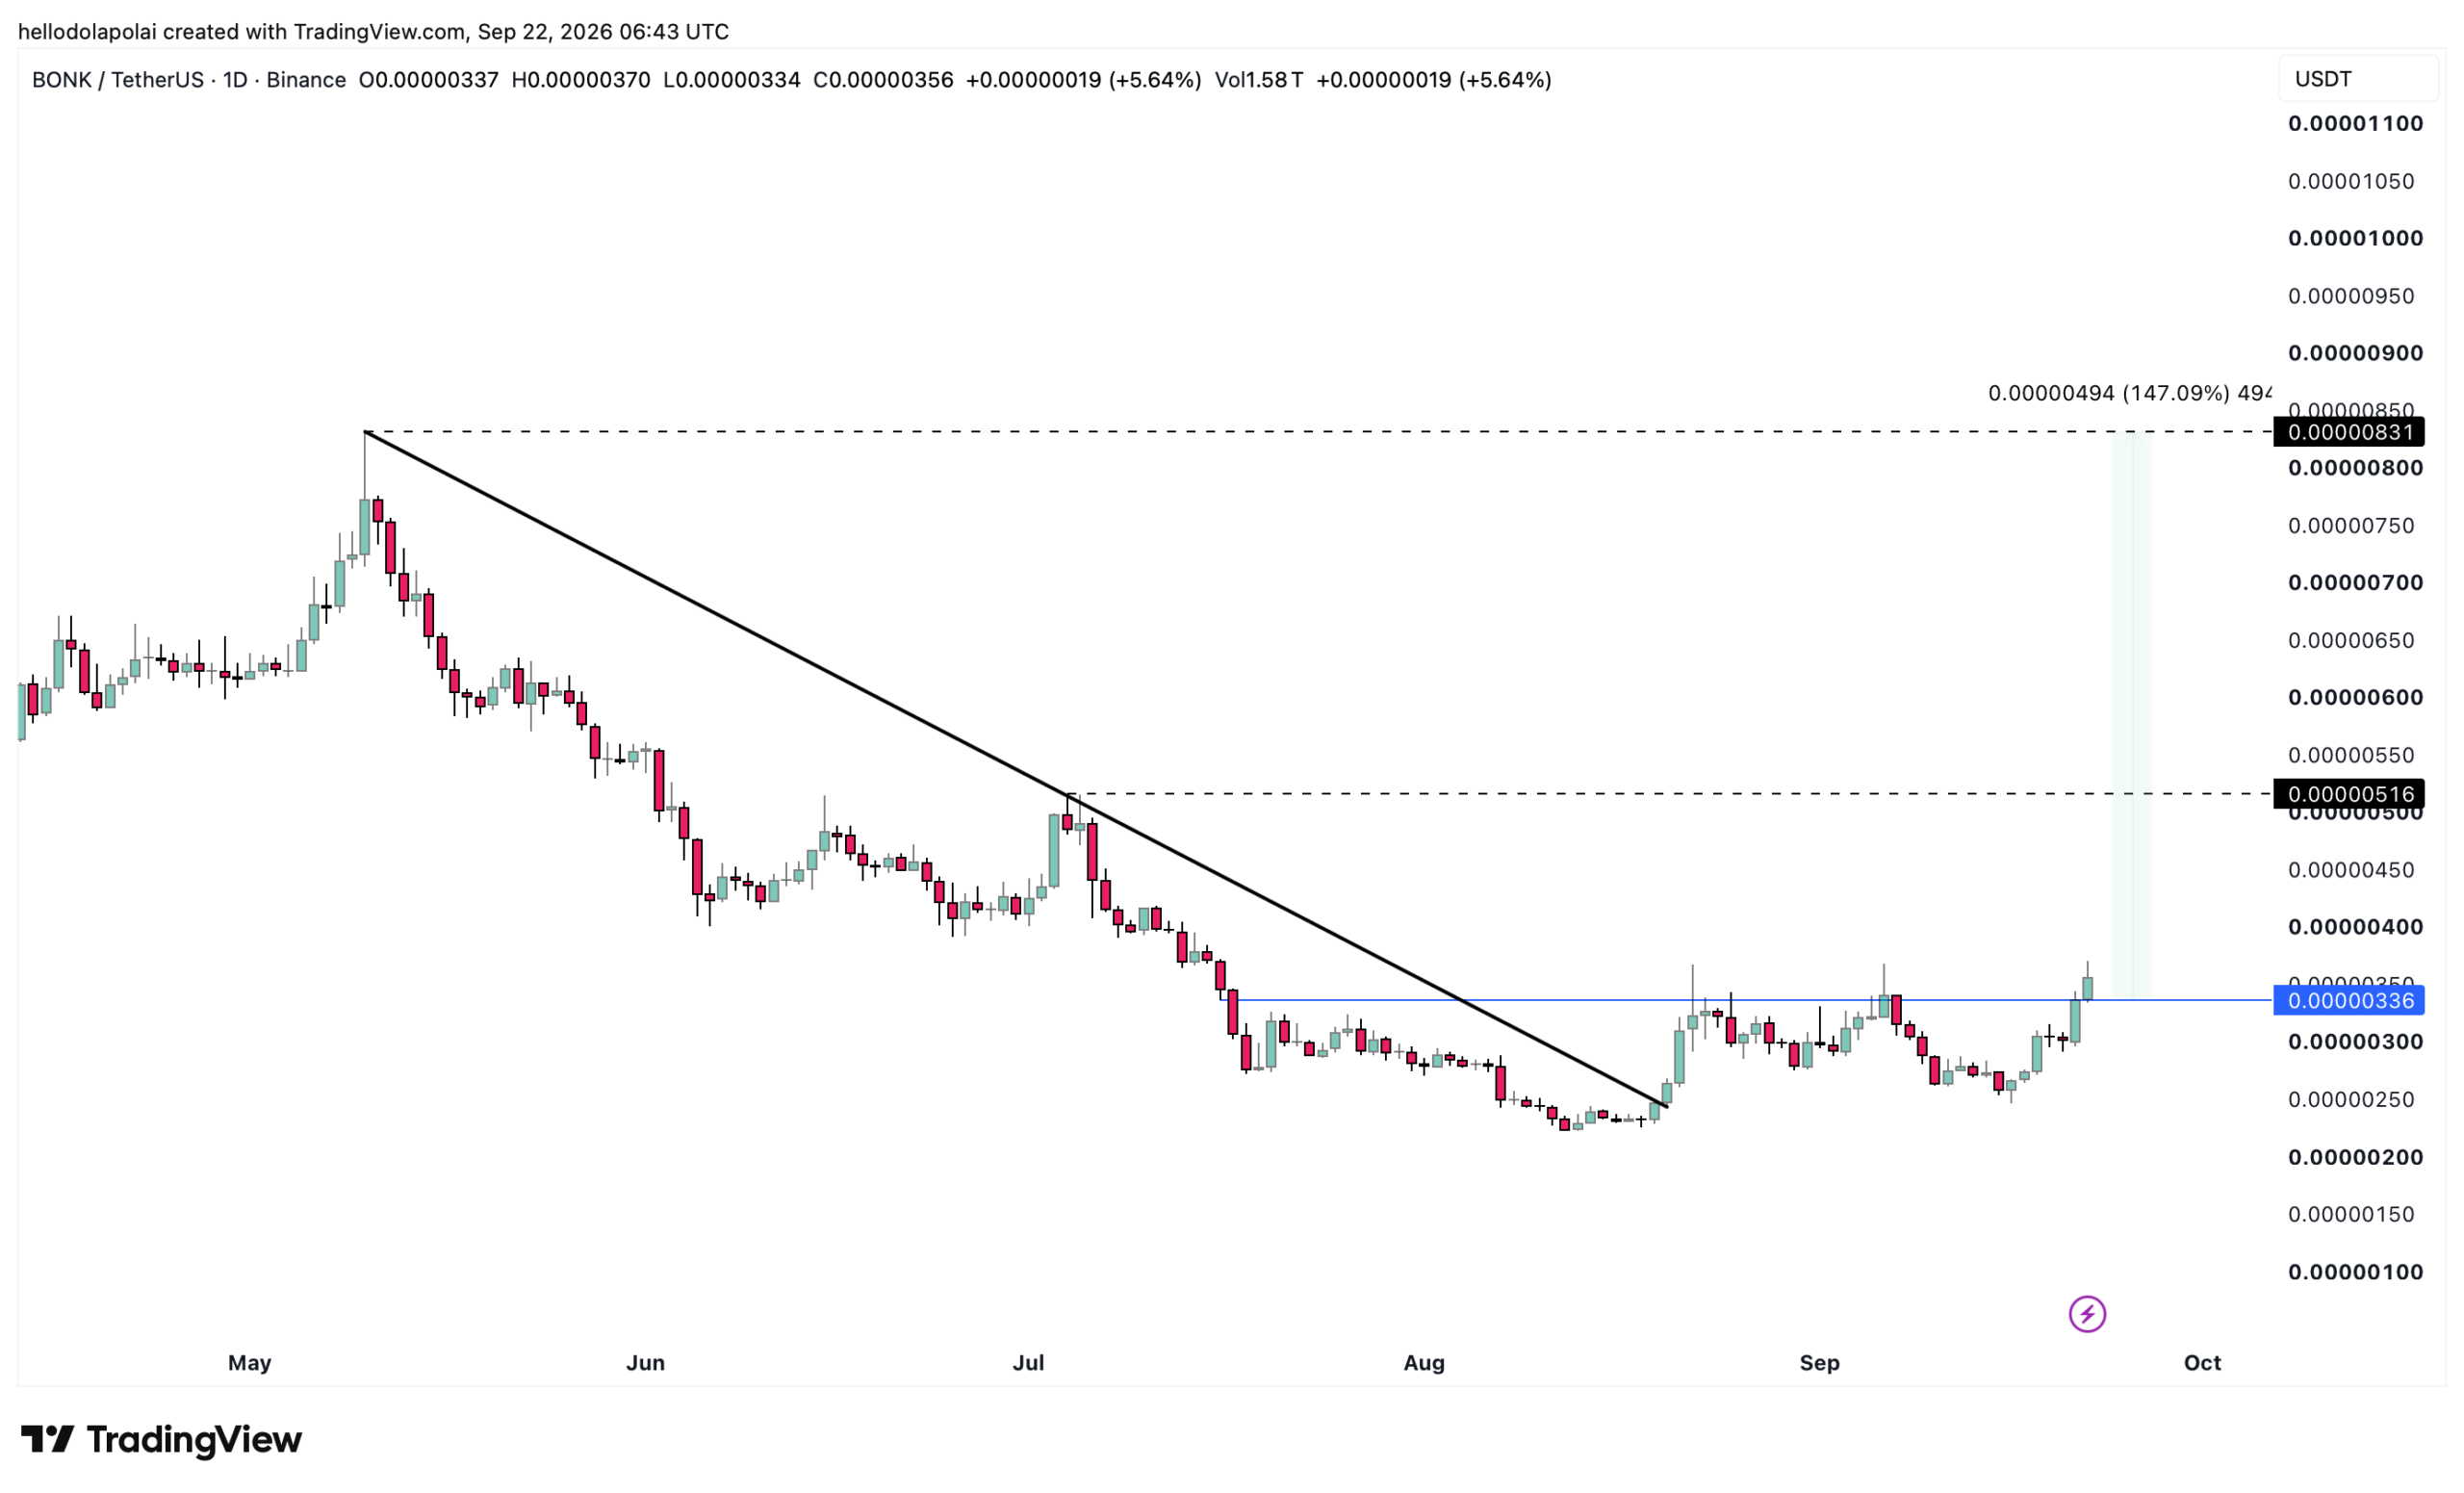
Ideally, a bullish break tends to be confirmed when price sees a narrow close candle above the resistance zone on the chart. This informs that investors in the market are bullish and are likely to force the asset higher in the near term.
If that’s the case, BONK has two high-level targets based on this, which are $0.00000516 and $0.00000831. At the peak of this rally, the cumulative gain would have amounted to roughly 147% in growth. Otherwise, there might be a short-term reversal.
Momentum supports further gains
Capital has been flowing into the market, as confirmed by the Money Flow Index (MFI).
Press-time data shows that the MFI has risen significantly, reaching roughly 65.57 on the chart, confirming that investors are buying more of the asset at the moment and would contribute to the price performance in the near term.
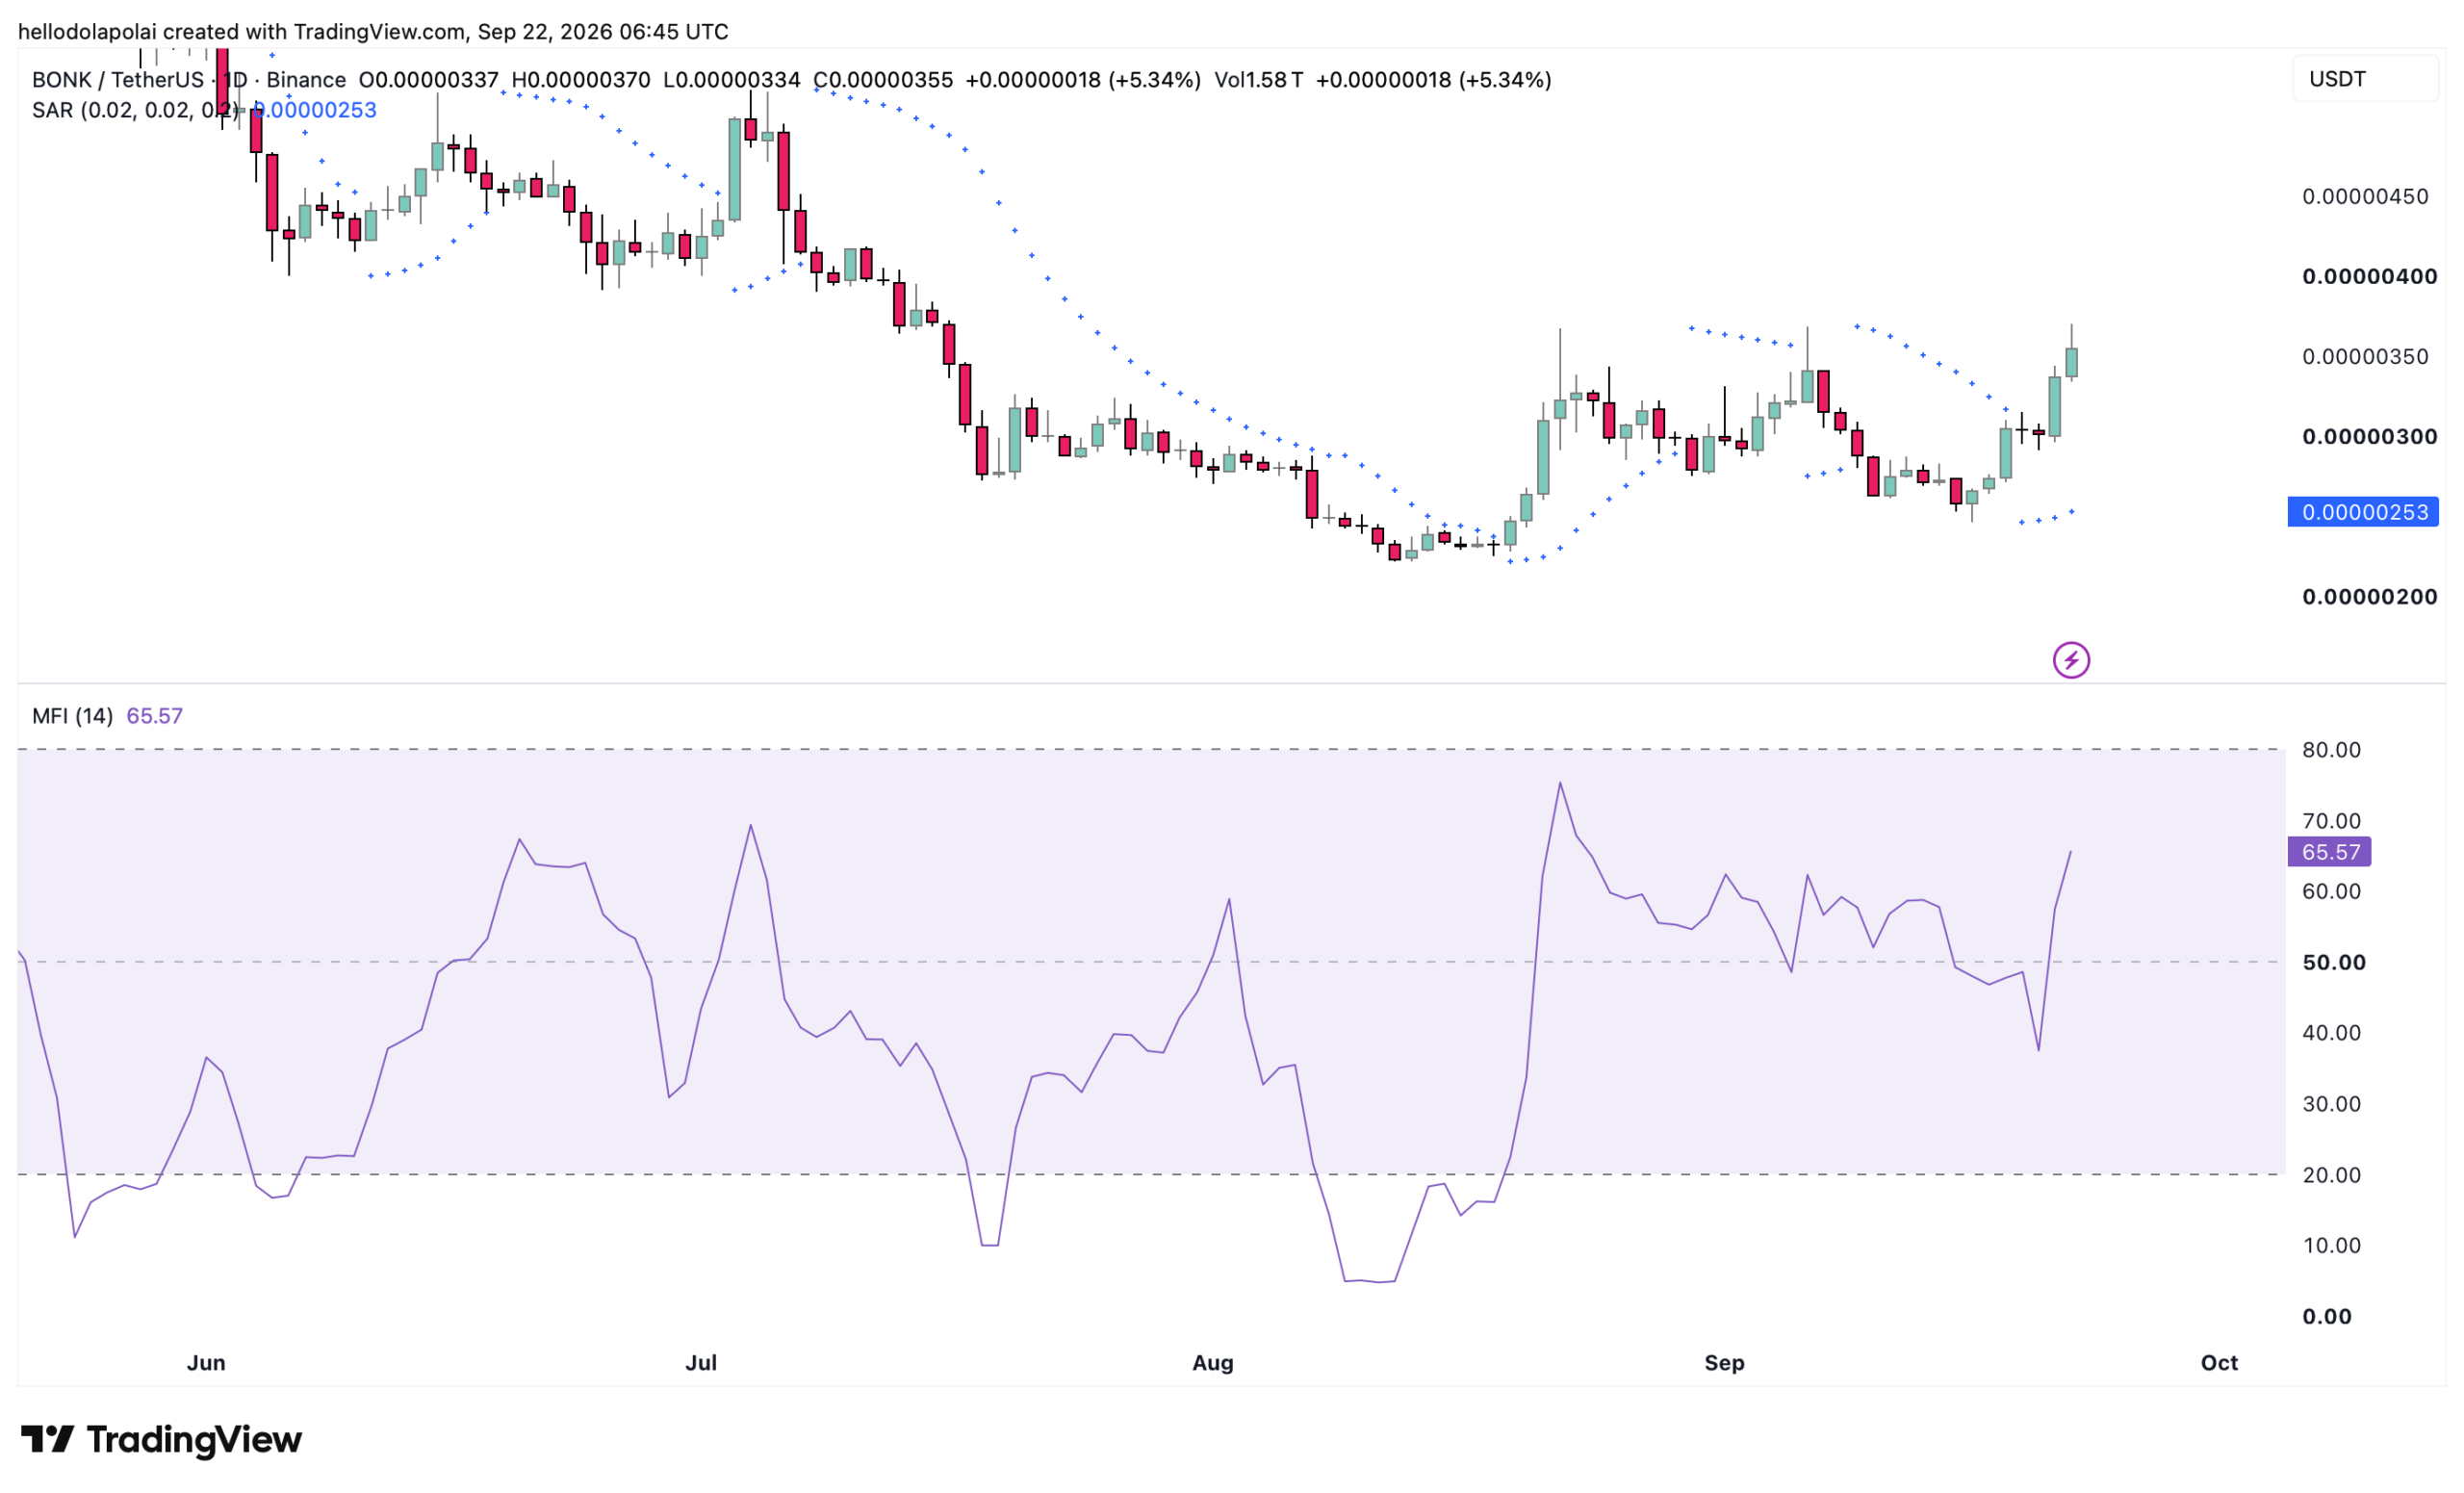
The MFI marks a bullish region between 50-80. Within that range, the asset is bullish, exceeding it, however, would signal an overvalued price.
Likewise, the Parabolic Stop And Reverse (SAR) has been on the bullish side of the market, with the dots forming below price.
When this happens, it usually implies that traders are accumulating the asset, which would drive it higher in the near term, potentially past the present resistance hurdle.
Spot selling could limit the rally
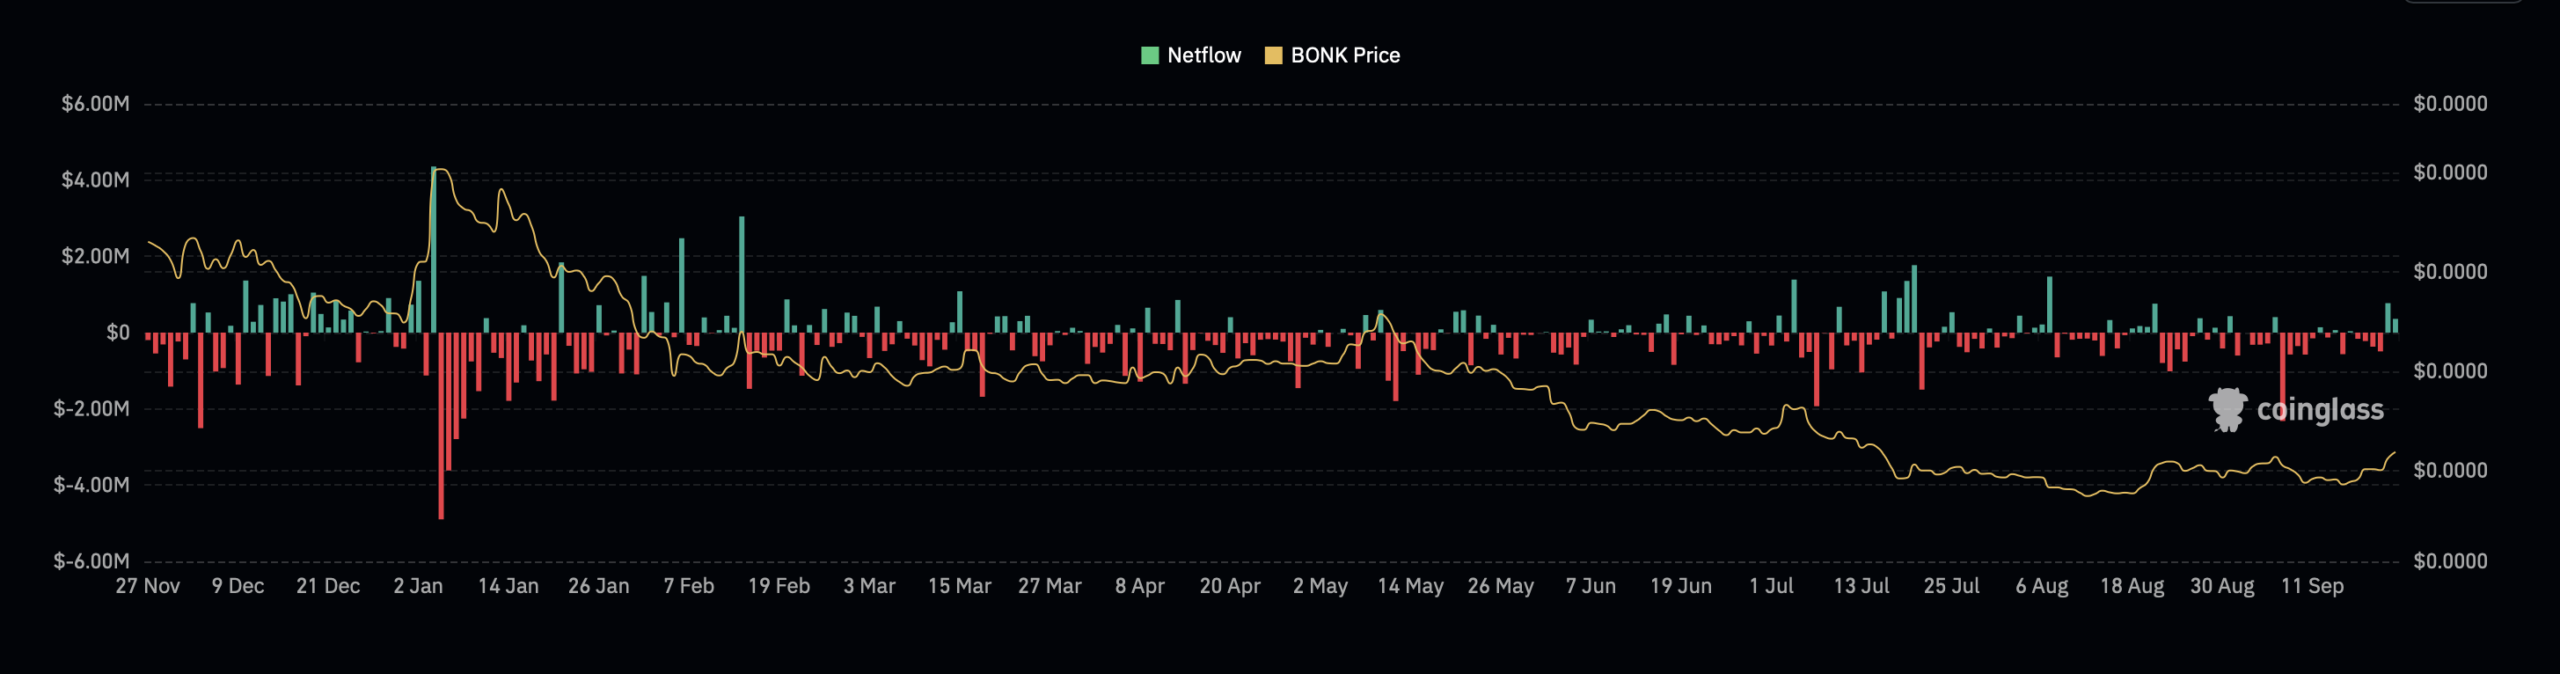
The major objection that BONK could suffer from is the Spot market activity that confirms selling overall. This is based on the Spot netflow, which shows that over the past two days, there’s been more selling as its netflow turned positive.
The netflow has dropped to roughly $532,000, which is a decrement from the previous day’s $772,270 at the time of this report. The downturn in netflow shows that there’s been a tapering down in selling pressure from investors in the market.
Final Summary
-
BONK’s bullish structure remains intact after breaking above its descending resistance channel, with $0.00000516 and $0.00000831 as key targets.
-
Spot selling remains a concern, although the decline in Spot netflow suggests selling pressure has started to ease.




Be the first to comment