


XRP has recovered almost 79% of its decline from $1.70 to $1.25, but the latest advance paused just below $1.60. The token also hesitated at this level in August before eventually breaking through it and reaching $1.70.
Key Takeaways
- XRP gained 4.4% over 24 hours.
- Weekly gains reached approximately 13.5%.
- $1.60 is the nearest resistance.
- Initial support now sits around $1.524.
- RSI confirms momentum but shows its speed.
XRP pauses at the 78.6% retracement
XRP traded near $1.57 at 15:06 UTC on September 22 after gaining approximately 4.4% over 24 hours and 13.5% over seven days, according to CoinMarketCap when checked.
The Bitstamp XRP/USD four-hour chart recorded a candle high of $1.595. That placed XRP within roughly 0.3% of the 78.6% Fibonacci level at $1.6.
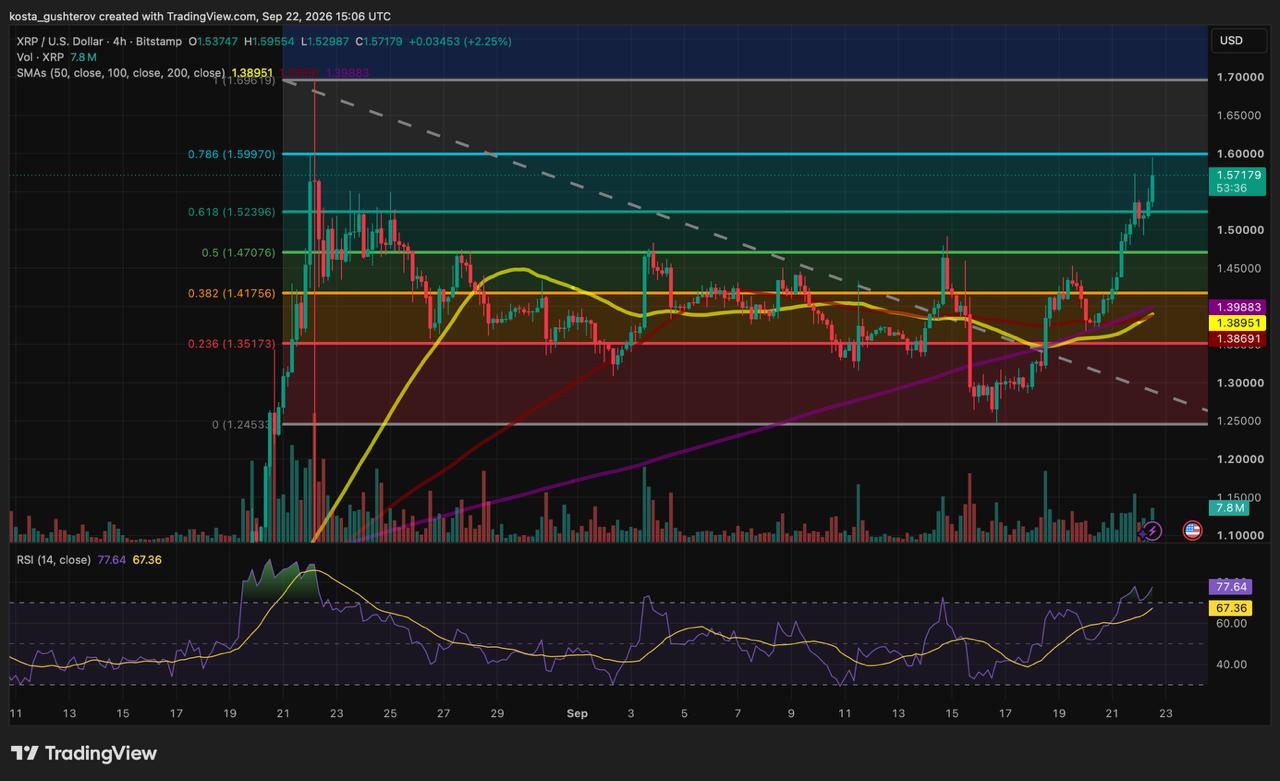
The Fibonacci scale measures how much of XRP’s decline from the August high near $1.7 to the subsequent low around $1.245 has been recovered. Reaching $1.6 means price has erased approximately 78.6% of that decline.
It is the highest retracement displayed on the chart before the August peak and therefore the closest resistance above the current price. XRP approached it but had not moved through it when the chart was captured.
The four-hour candle was still open, so the move represented an active test rather than a confirmed rejection. A wick near $1.60 shows that selling appeared there, but it does not establish whether that supply will remain during the next attempt.
XRP reacted the same way at $1.60 in August
The previous encounter gives $1.60 more significance than a Fibonacci calculation alone.
During the late-August rally, XRP reached approximately the same level and initially pulled back toward the mid-$1.40s. A second advance then carried price through $1.60 and into a local high near $1.70.
That breakout did not establish lasting support. XRP later surrendered the advance and fell to approximately $1.245 on September 16. The token has since recovered by roughly 26% from that low.
Late-August test
- Initial pause near $1.60
- Pullback toward the mid-$1.40s
- Second push to approximately $1.70
Current test
- Recovery from approximately $1.245
- Break above the descending trendline
- First pause immediately below $1.60
The August move shows that XRP can pause at $1.60 and still advance. It does not make another move to $1.70 automatic.
The route back to $1.60 is different this time
The resemblance ends at the level itself. The route XRP took back to $1.60 provides more useful evidence about the current attempt.
The most important structural change occurred before XRP reached the Fibonacci barrier. Price broke above the descending trendline connecting the lower highs formed after the August peak. It then cleared the 38.2% retracement near $1.418, the midpoint at $1.471 and the 61.8% level around $1.524.
Our previous XRP price analysis identified the low-$1.40s as the barrier facing the recovery. XRP has now moved through that area and created several possible support levels between its current price and the September low.
XRP therefore did not jump directly from $1.25 to $1.60. It recovered one section of the previous decline at a time, giving the next pullback clearer reference points.
Industry views are bullish, but on different time frames
Veteran trader Peter Brandt added a longer-term perspective on September 21. In an X post containing a monthly XRP chart, Brandt said the structure implied an “eventual advance” to $5.40.
This is my long-term chart of ripple:native It implies an eventual advance to $5.40
A claim of a “call” or simple presentation of a chart is NOT a trade People who claim “trades” need to provide proof or else the claims are BS An X post is NOT proof pic.twitter.com/Szu6FiZq2T— The Factor Report (@PeterLBrandt) September 21, 2026
He also stressed that publishing a chart is not evidence of an actual trade or a recommendation to buy. No deadline accompanied the projection.
Brandt’s analysis covers a multi-year monthly structure, while the $1.60 test in this article comes from a four-hour chart. The two should not be treated as interchangeable. XRP would first have to clear $1.60, reclaim the August high near $1.70 and overcome additional resistance before a distant level such as $5.40 became relevant.
The network backdrop is also mixed rather than uniformly bullish. A September CoinDesk analysis of XRP Ledger activity found that second-quarter order-book trading increased by 79% from a year earlier. However, the number of accounts initiating those trades fell by approximately 41%.
That means more XRP was changing hands through a smaller group of active accounts. CoinDesk also reported that average tokenized-asset and RLUSD balances on the network reached approximately $4.26 billion during the quarter.
Those figures show that larger-value activity is developing on XRP Ledger, but they do not prove that network use caused the latest price increase or that demand will be sufficient to clear $1.60.
Momentum supports the rebound, but the trend is not fully repaired
The moving averages have not completed a bullish alignment
XRP is trading above its 50-, 100- and 200-period simple moving averages on the four-hour chart. All three are tightly grouped between approximately $1.387 and $1.399, showing where the market spent much of September reaching a temporary balance.
A conventional bullish alignment would place the 50-period average above the 100-period average, with both above the 200-period average. XRP has not reached that arrangement yet: the 50-period average is slightly above the 100-period average but remains below the 200-period average.
Price has therefore improved faster than the slower indicators can reflect. Moving above all three averages strengthens the short-term recovery, but their current order does not yet confirm a sustained trend reversal.
The cluster is also approximately 12% below XRP’s current price. It could become relevant during a deeper correction, but it is too distant to provide immediate support.
RSI confirms the rise but shows its speed
The four-hour relative strength index reached approximately 78. The reading shows that XRP arrived at $1.60 after a rapid recovery instead of a long period of consolidation.
There is no clear bearish divergence on the displayed chart. XRP has made progressively higher September highs, and RSI has risen with them. A bearish divergence would require price to reach a higher high while RSI records a lower high; that pattern is not visible yet.
Momentum therefore continues to support the rebound. The risk comes from how much ground has already been covered: XRP climbed roughly 26% from its September 16 low before reaching resistance. The first pullback may reveal more about remaining demand than the overbought reading alone.
Volume also expanded as XRP crossed $1.47 and $1.52. The latest candle showed approximately 7.8 million XRP in volume, but it was incomplete and cannot yet be compared fairly with completed four-hour candles.
Three reactions that would change the chart
The first touch is no longer the important part
XRP has already shown that it can return to $1.60. The more useful test is whether price can remain above the barrier after momentum cools. A move that survives a pullback would establish something the current wick has not: evidence that $1.60 is changing from resistance into support.
This article is provided for informational purposes only and does not constitute financial or investment advice. Cryptocurrency prices and technical indicators can change rapidly while chart candles remain open.

Alex is Editor-in-Chief of Coindoo and co-founder of Millennial Media Group, with nearly a decade of experience covering financial markets – crypto first, then everything else.
It started in 2016 with Bitcoin. Like most people at the time, he didn’t fully understand it – so he kept digging. Blockchain, tokenomics, the projects, the cycles. That curiosity never stopped, and eventually pulled him into traditional markets too: equities, commodities, macro. Not because he left crypto behind, but because you can’t properly understand one without the other.
What drives him is straightforward: he wants to know why something is happening, not just that it’s happening. Most market coverage stops at the headline – price up, price down, here’s a chart. Alex finds that kind of reporting actively unhelpful. If you walk away from an article without understanding the mechanism behind the move, what did you actually learn?
He holds a degree in Tourism from New Bulgarian University – not the most obvious path into financial markets, but markets have a way of pulling in people who are simply too curious to stay out. He has authored over 200 in-depth analyses and more than 10,000 articles across crypto and traditional finance. He still thinks every day in markets teaches him something new. That’s probably why he hasn’t stopped.



Be the first to comment