


What to know:
- Solana drops below key support zones, confirming bearish pressure.
- Indicators show weak buying strength with no clear reversal signal yet.
- Long-term structure still hints at a potential major breakout cycle.

Solana faced renewed selling pressure at the end of March as its price structure shifted sharply on higher timeframes. Market data shows that the asset has moved out of a prolonged consolidation phase and entered a clear downtrend.
The change occurred as a result of repeated failures to trade above the region of $200-$240, as selling pressure far outweighed buying interest.
The decline below $125 and $110 represented a major change, as these areas previously acted as support levels. The accumulation pattern is now clearly a distribution pattern, and sellers are firmly in control.

Solana Faces Bearish Momentum as Indicators Turn Negative
From a technical perspective, we are seeing strong bearish pressure. Bollinger Bands are expanding downwards, indicating higher volatility; however, the price remains near the lower Bollinger Band.
According to the analysis from Tradingview, the range of $110 to $115 has now become resistance, and any rise in the short term will be a selling opportunity.

Source: Tradingview
The Ichimoku Cloud also remains a significant hurdle, with prices trading well below it and both lines trading in a downtrend. Momentum indicators are also supporting the bearish view.
RSI is trading in the low 30s, nearing the oversold region but failing to show any signs of a reversal, while MACD remains bearish but shows signs of weakening selling pressure, which could result in a trading range rather than a change in trend.
Also Read: Solana (SOL) Developer Growth Surges, Price Momentum Points to $90 Target
Key Levels Define Next Market Direction
From a price perspective, the range of $80 to $85 is now providing support. This level has some significant psychological value and has been reacted to previously.
If the price falls from here, the next level of support would be between $65 and $70, where there is previous demand. Resistance is also built up.
There is a level of resistance at around $95, and then a stronger level of resistance at around $110 to $125. These are previous support levels, but now that they are acting as resistance, it is becoming difficult for the price to recover.
Long-Term Structure Keeps Bullish Scenario Alive
Although it may not be doing well currently, its long-term forecasts are not ignored. On March 28, analyst Ray shared his perspective on the bigger picture, saying, Solana’s valuation of $1,000 is not speculation; it is a long-term milestone.
Indeed, when one looks at the bigger picture, one may see a different perspective from its current short-term decline.
After its last cycle, this asset had a huge decline, followed by a broad range of accumulation. Price actions are currently forming a tightening pattern, possibly a symmetrical triangle.
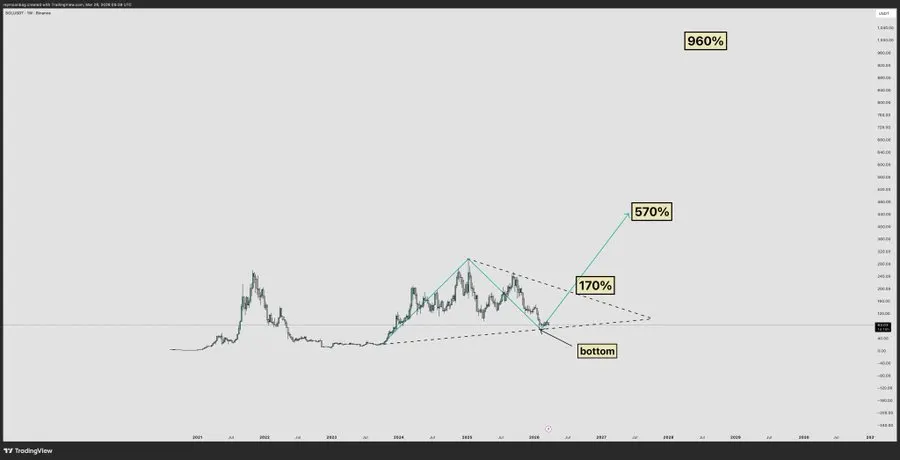

Source: X
This is a balance of both sides; we have lower highs and higher lows. This squeeze is going to have a strong breakout. Estimates are that a possible move of 170% is possible after a breakout.
More expansion could bring a potential of 570% and even 960% in a complete cycle, as we have witnessed in the past.
This article contains market analysis and price predictions. These are not guarantees. Crypto markets are volatile. Always DYOR. Not financial advice.
Also Read: Is Solana Preparing for a Massive Rally Toward $1,000 After 77% Correction?

Be the first to comment