



XRP seems to be gaining market traction due to the continued inflows seen by US spot XRP ETFs, with the crypto near $1.55. Spot XRP ETFs witnessed combined net inflows worth $52.95 million over the period of September 22 through September 24.
Meanwhile, XRP has retreated from the level of $1.63 and is getting ready to close below its weekly close at the 50-week exponential moving average. It has been the ETF interest and narrow trading range that have made the price zone $1.50 – $1.60 the focal point.
What Happened With XRP?
The recent data emanate from continued activity on US Spot XRP ETFs, which experienced net inflows for each trading session in the period between September 22 and September 24, amounting to about $52.95 million. The Bitwise XRP ETF had inflows of $9.91 million on September 24, while the Franklin XRP ETF had net inflows of around $4.98 million.
These latest inflows have been added to an ever-growing list of regulated products with holdings of XRP. Other earlier documents disclosed the XRP-related products by ProShares, such as its Ultra XRP ETF under the ticker UXRP. According to ProShares, UXRP aims to achieve two times the daily performance of the Bloomberg XRP Index.

It provides an investor with an additional path to access XRP through leverage via an exchange-traded product without holding the actual XRP. It is worth noting that UXRP is a leveraged ETF and not a spot XRP ETF, which makes its returns different from those of XRP.
Why Is the Market Watching XRP?
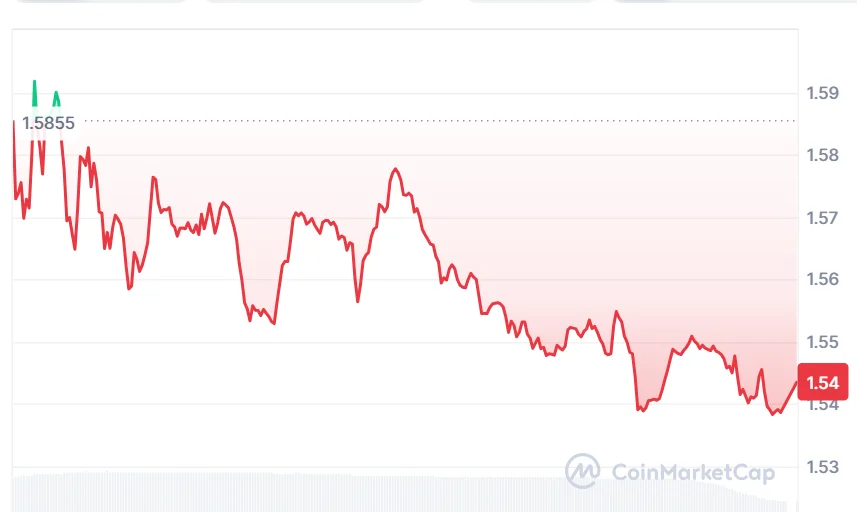
Meanwhile, XRP stays in the spotlight despite the growth of ETF flows, considering that the token is hovering near an important technical level. XRP is currently trading at $1.54, with a 24-hour trading volume of $5.18 billion and a market cap of $96.83 billion. XRP is down by 1.89% over the last 24 hours, according to market statistics.
The new ETF flows give another gauge for assessing investors’ activity. The inflows amounting to approximately $52.95 million for U.S. spot XRP ETFs over September 22-September 24 come after periods of weaker flows and indicate that demand has increased recently.
There has been growth in the overall ETF market for XRP as well. ProShares currently includes UXRP as part of their cryptocurrency-related ETFs, where they target 2x the daily return of the Bloomberg XRP index.
Also Read | ENA Price Eyes $0.365 as Binance Partnership Expands USDe Strategy
What Does the Technical Setup Show?
XRP has seen a move towards $1.63 and has backed off, coming into the $1.50 range. This means that, structurally, we have $1.50 as an important bottom end, while $1.60 is the upper end of the range that ChartNerd points out.
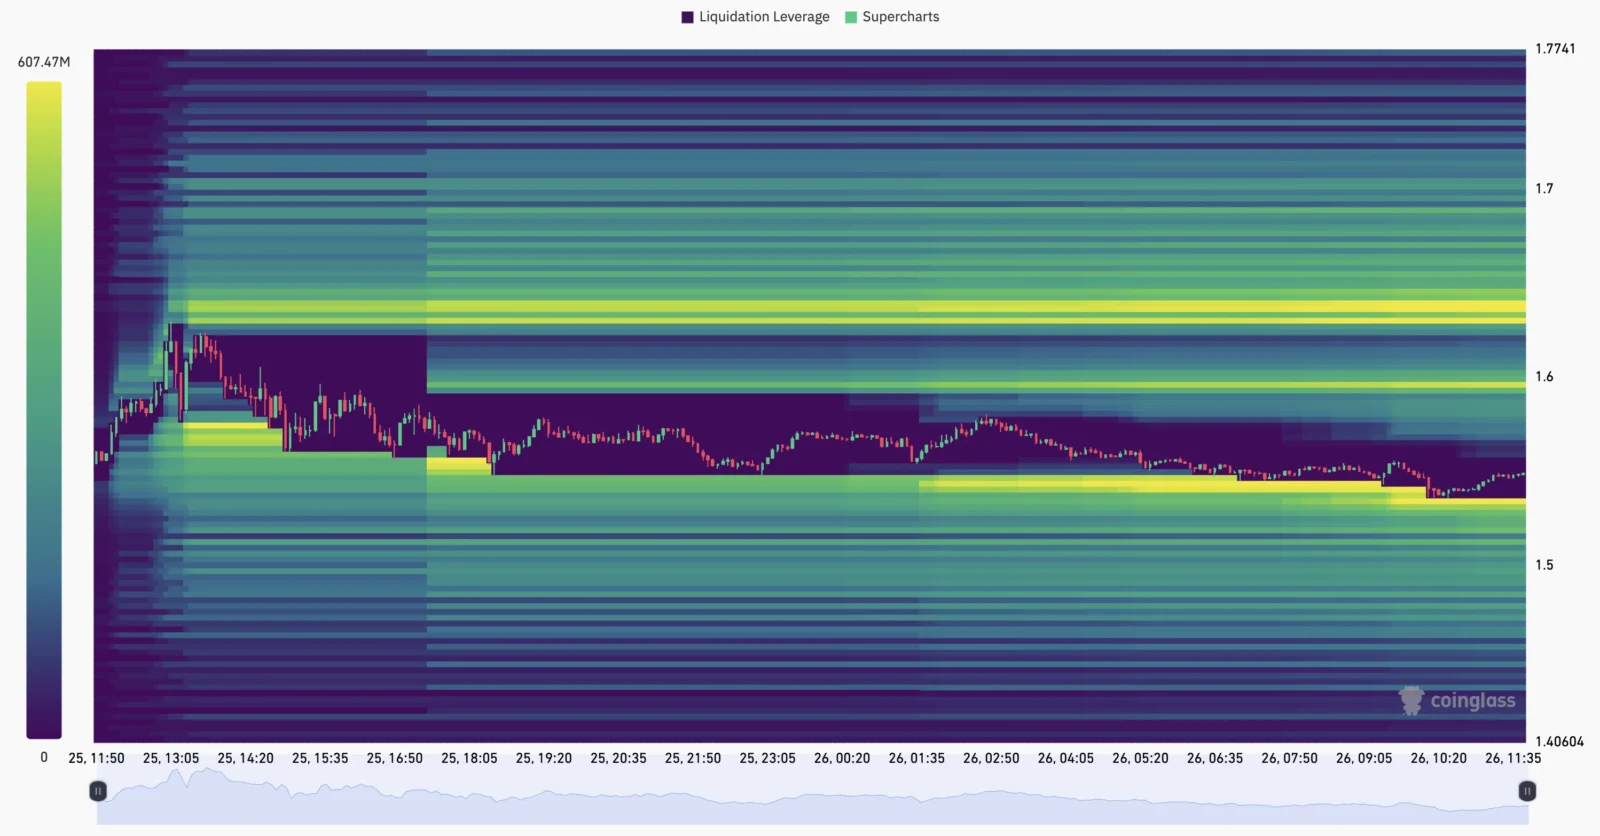
As ChartNerd has noted, the $1.55 level is an important liquidity level because the price has swept the liquidity from the previous day. Additionally, ChartNerd noted the neutral funding and volume reduction over the weekend.
The middle, upper, and lower bands of the Bollinger Bands from the available technical details for XRP stand at $1.41871, $1.60015, and $1.23727, respectively. XRP is trading above the middle but below the upper bands.
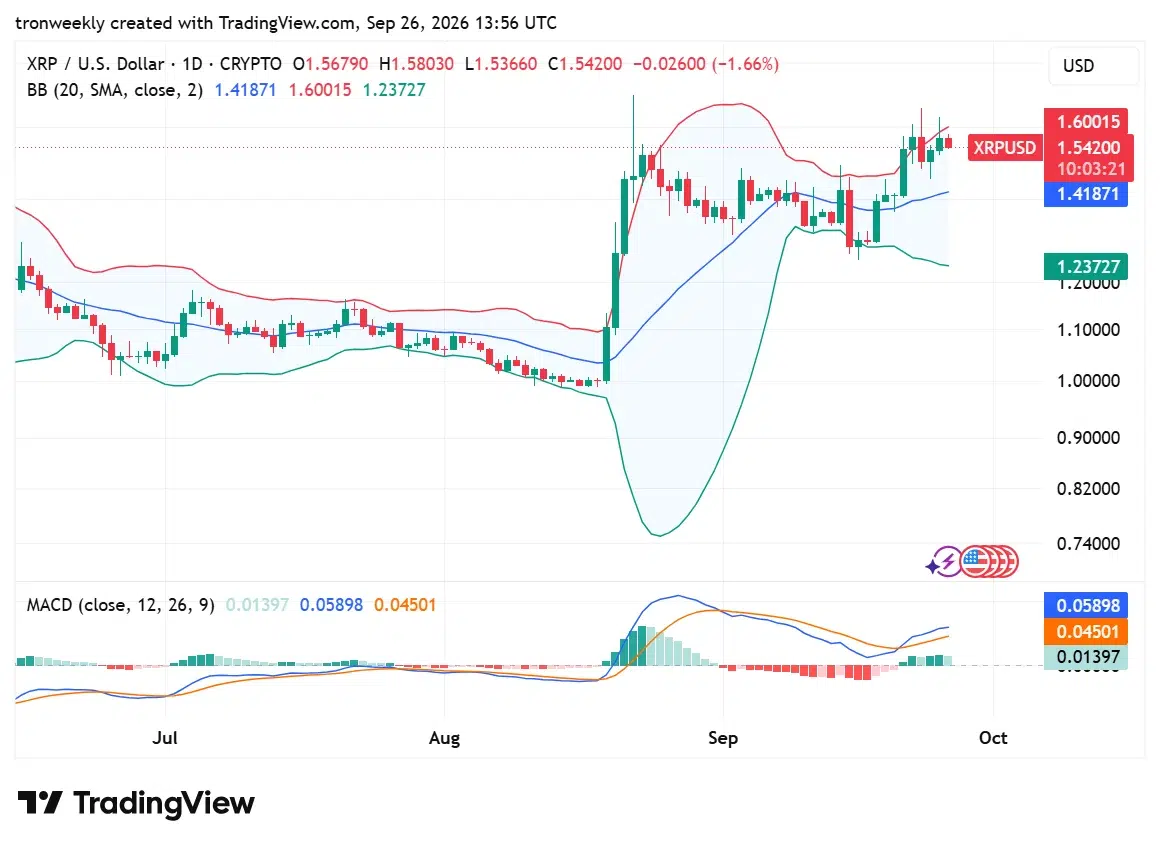
The MACD indicator has a line value of 0.05898 and a signal line of 0.04501. Consequently, the histogram value stands at 0.01397, keeping the MACD value positive. However, XRP is trading below the recent $1.63 high. A rise above $1.60 will make the $1.63 level significant, while a drop below $1.50 will pressure the lower end of the range.
What Analysts Are Saying
ChartNerd pointed out the $1.55 liquidity zone as XRP crossed the previous day’s liquidity level. It is also worth mentioning neutral funding levels and the decreasing weekend volume; the current situation is consistent with a range from $1.50 to $1.60.
Meanwhile, crypto analyst Xaif Crypto brought up the XRP-themed ETFs offered by ProShares. Official ProShares information shows that UXRP tries to replicate twice the daily movement of the Bloomberg XRP Index. This is a technical overview from analysts combined with ETF activity.
What Happens Next?
The following important level for XRP is a weekly close above the 50-week exponential moving average, together with the 1.50-1.60 price range.
Another important market indicator is ETF flows. Strong flows would be further confirmation of demand for regulated exposure to XRP, whereas weak flows would point to a reduction in activity recently.
In terms of price, the resistance is $1.60 and then $1.63, which was recently seen. The support is $1.50 on the downside. An advance outside these levels would provide more insight into the next stage of market action for XRP.
ETFs are seeing further evolution, with ProShares allowing investors to leverage XRP via UXRP and spot XRP ETFs in the United States seeing more inflows into them.
Thus, XRP comes into its weekly close with two factors at play: the ongoing demand from regulated investment instruments and the technical setup in the range of 1.50-1.60. It’s important to pay attention to the $1.55 liquidity zone and $1.60 resistance.
Also Read | Solana Token Supercycle: Explosive Positive Breakout in 2026
This article contains market analysis and price predictions. These are not guarantees. Crypto markets are volatile. Always DYOR. Not financial advice.



Be the first to comment