


Bitcoin fell toward $82,760 amid renewed U.S.-Iran tensions and broader weakness across risk-sensitive markets, before returning near $83,150 at the time of writing.
The immediate chart level is near $81,300. Bitcoin previously struggled around this area before breaking higher. It is now the closest meaningful support zone below the market, rather than an exact price that must hold to the dollar.
The question is whether Bitcoin’s pullback is a short reaction to renewed headlines or the start of a broader repricing of energy and inflation risk. The nearby former breakout area gives that question a clear technical test.
The market’s Hormuz optimism has faded
Bitcoin’s decline followed a more optimistic phase for the market. Earlier reports of U.S.-Iran discussions over a phased reopening of the Strait of Hormuz helped BTC return above $84,000. Coindoo covered that earlier rebound when the prospect of reduced disruption was still driving sentiment.
The talks are no longer offering the same reassurance to markets. Iran has maintained the conditions attached to its proposed temporary reopening of the waterway, while President Donald Trump rejected the offer. He has said negotiations could continue, yet has not ruled out further U.S. strikes, according to CoinDesk’s report on the latest comments.
There is still a route to talks, but no accepted framework for reopening Hormuz. Traders who had treated the earlier diplomacy as a reason to reduce geopolitical risk now have to consider the possibility of a longer disruption.
Oil turns diplomacy into a macro risk
Brent crude briefly climbed above $106 while Iran held to its proposed terms and Trump rejected the offer. A Reuters report described the move as a response to stalled talks and continued pressure around the Strait.
Bitcoin does not mechanically follow oil. The concern is that prolonged energy disruption can lift inflation expectations, push yields higher and make investors less willing to hold volatile assets.
Nasdaq futures also weakened alongside Bitcoin during the latest move. That points to a wider reassessment of risk, rather than a crypto-specific event.
Bitcoin’s rebound from roughly $82,760 shows that buyers appeared after the initial sell-off. It does not yet establish that markets have absorbed the risk created by the stalled negotiations or restored the confidence that carried BTC above $84,000.
The chart puts $81,300 under the spotlight
The nearest support sits around the $81,200-$81,400 area. This zone acted as a visible horizontal barrier during the late-August and early-September advance. Bitcoin eventually broke through it before rallying toward the recent high around $87,000.
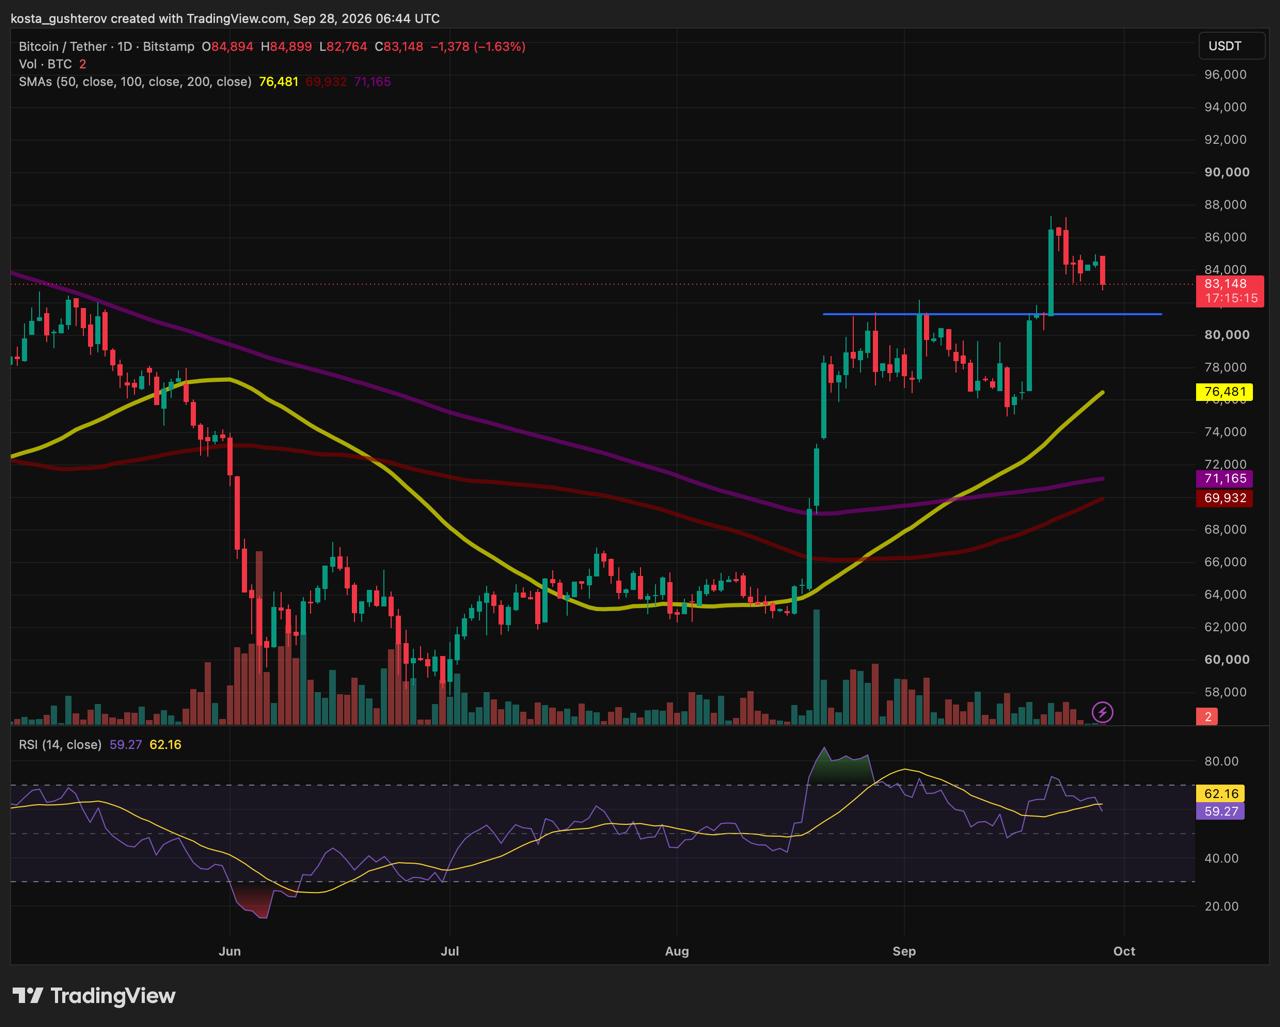
That history gives the area a clear role during the present decline. A former ceiling can provide support after a breakout, although only a sustained hold would confirm that buyers still control it.
A daily close above the support area would preserve the view that the pullback is testing former resistance. Continued trading beneath it would bring the deeper moving-average supports into view, including the rising 50-day SMA near $76,500.
What could move Bitcoin this week
Neither one diplomatic comment nor one red daily candle resolves the current market question. Traders are watching whether the conflict could disrupt energy flows for longer, whether higher oil prices reach inflation expectations and whether risk assets can absorb both pressures.
The chart shows where buyers may respond. The developments below show what could shape that response.
A real diplomatic change around Hormuz
Markets need more than competing statements from Tehran and Washington. Traders will be watching for a mutually accepted reopening mechanism, evidence that shipping can resume safely and signs that physical flows are improving.
Whether oil keeps adding to inflation fears
A short oil spike and a sustained rise carry different implications. If Brent stays elevated while yields rise and Nasdaq futures remain weak, pressure on Bitcoin could persist even without a new escalation.
This week’s U.S. data calendar
Three scheduled releases could shape the macro backdrop for Bitcoin this week. The August PCE report arrives Wednesday, September 30; ISM releases its September manufacturing survey on Thursday; and the September jobs report follows on Friday.
PCE will show whether inflation pressure is easing or persisting. ISM can provide an early reading on factory activity, supply conditions and input costs. Payrolls will shape expectations for growth, wages and interest rates. With oil already lifting inflation concerns, traders will be watching whether the data reinforce that pressure or give markets room to look past it.
Bitcoin is testing how much uncertainty the market can absorb
The next phase depends on evidence, rather than another round of competing statements. A workable Hormuz agreement would reduce the energy-risk premium. A prolonged impasse would leave markets focused on oil, yields and incoming U.S. data.
For Bitcoin, the prior breakout zone is the immediate test. A sustained hold would show that buyers are still defending the area despite renewed geopolitical pressure. A loss of it would suggest that the earlier advance needs more time to rebuild.
This article is provided for informational purposes only and does not constitute financial or investment advice. Cryptocurrency markets are volatile, and technical levels can change quickly.

Kosta has reported on cryptocurrency markets and blockchain infrastructure since 2020, bringing over six years of hands-on experience in the crypto industry built through daily tracking of markets, trends, and emerging blockchain developments. Specializing in Bitcoin on-chain analysis, institutional ETF flows, and digital asset price action, his work at Coindoo has been cited by other news agencies and consistently covers market developments with a focus on data-driven reporting across Bitcoin, Ethereum, Solana, and XRP.
Over the years, Kosta has contributed to multiple crypto media outlets in different regions, authoring over 6,000 articles across the sector. His reporting spans cryptocurrency markets and the broader fintech industry, tracking not only price action but also the technological and regulatory forces shaping the ecosystem.
To support his analysis, Kosta actively leverages on-chain data and metrics from leading platforms such as Santiment, Glassnode, and CryptoQuant, enabling deeper, evidence-based market insights. He believes in the power of transparency and the data that underpins the blockchain ecosystem.
His academic background in Marketing Management from Denmark further complements his analytical approach, adding a strong understanding of communication strategy and content positioning to his work.



Be the first to comment