



Ethereum’s short-position debate spread across Crypto X on Sunday, but Monday’s data offer a more complicated answer about what actually changed.
Ethereum’s short debate in three dates
The CryptoQuant chart places aggregate ETH futures open interest near $16.08 billion, while ETH traded close to $2,775.
September 27 · Crypto X focused on a short-squeeze risk
Several crypto accounts shared the concern that large bearish ETH positions could become vulnerable if price reversed higher.
September 28 · Bitfinex short gauge drops sharply
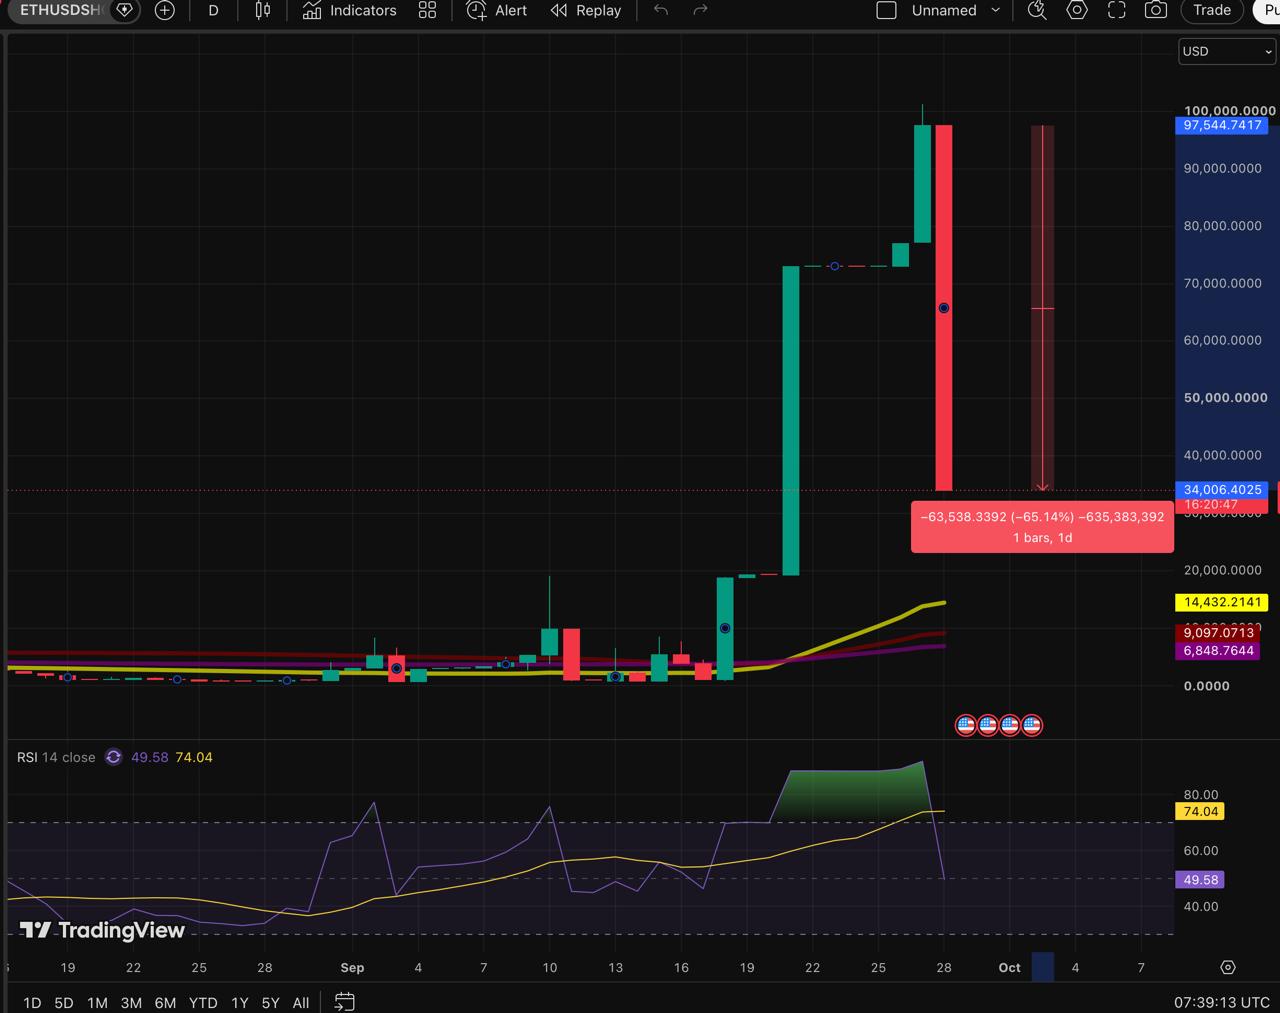
The Bitfinex ETH/USD Shorts reading fell about 65%, while ETH traded near $2,650.
The timeline raises a clear question: did widely shared posts make some traders more willing to close ETH shorts? The charts show that positioning changed. They cannot identify why individual traders acted.
Crypto X turned positioning into a shared narrative
On Sunday, Crypto Goos, Crypto Rover and Coin Bureau each drew attention to Ethereum shorts and the possibility of a squeeze.
🚨ALERT: ETH bears are going ALL IN on Bitfinex.
ETH short positions have EXPLODED by roughly 13,000% in just TWO WEEKS, surging from around 771 ETH to over 101,000 ETH.
That is an EXTREME buildup in bearish positioning, and it could become POWERFUL short-squeeze fuel if $ETH… pic.twitter.com/PXjX6R1jD1
— Coin Bureau (@coinbureau) September 27, 2026
The discussion centred on derivatives positioning. If ETH rose quickly, traders holding bearish positions could face mounting losses and may need to buy ETH to close their exposure.
For a leveraged trader, seeing that argument repeated across several large accounts can alter risk management. A short may still appear reasonable, yet the potential cost of being caught in a rapid squeeze can become harder to accept.
The broader open-interest decline started before Sunday
The timing limits any claim that Crypto X caused Ethereum’s wider leverage reduction. Aggregate ETH futures open interest had already been declining from its September 21 peak before the Sunday posts circulated.
CryptoQuant’s chart shows open interest near $16.08 billion on September 21 and about $14.06 billion on September 28. That is a reduction of roughly $2 billion, or around 12.5%, across the period.
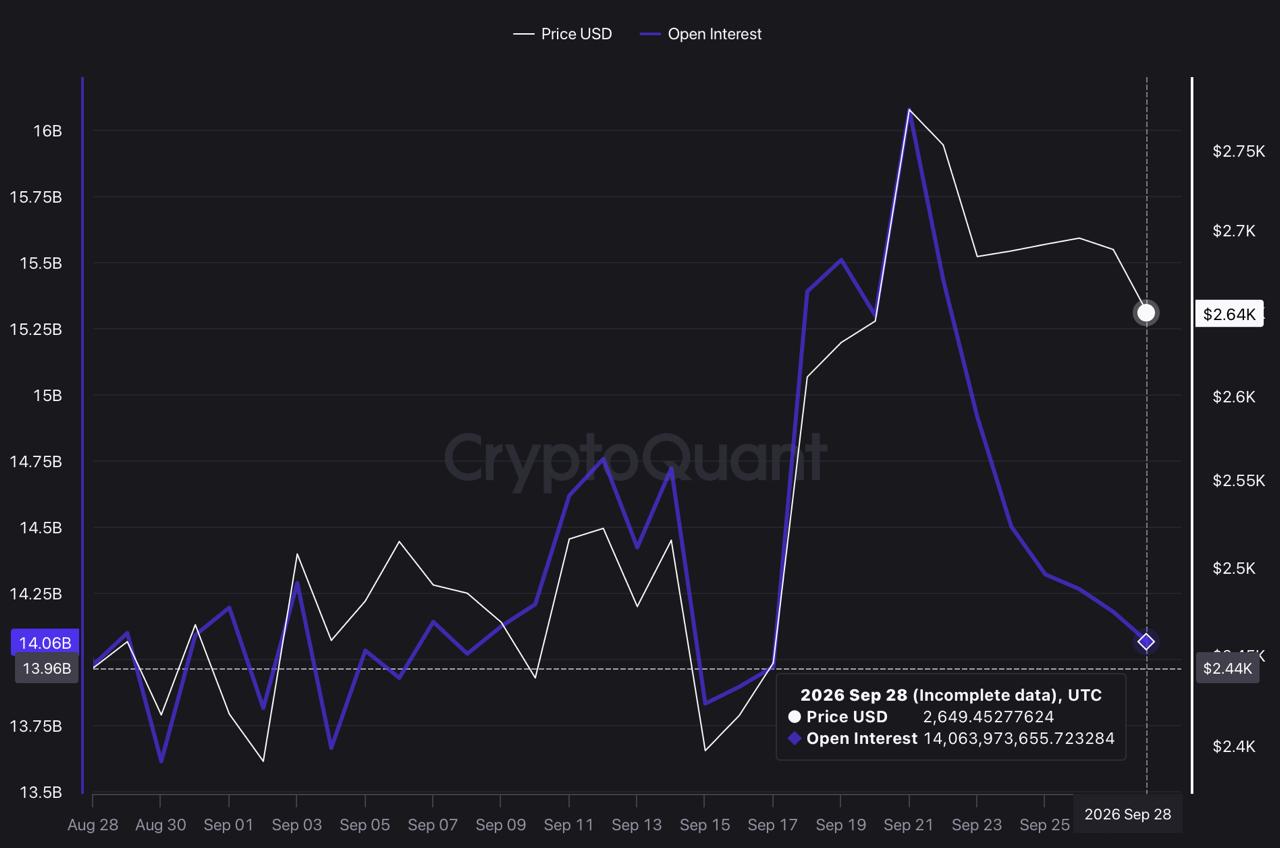
Open interest measures the value of outstanding futures contracts. Each contract has both a long and a short side, so a falling total can reflect profit-taking, liquidations, position closures or capital moving elsewhere. It does not reveal which side initiated the change.
The two charts also describe different timelines. Aggregate ETH open interest began falling after its September 21 peak, while the Bitfinex ETH/USD Shorts gauge continued rising into September 27. That divergence helps explain why the short-squeeze narrative gained attention: bearish exposure was still building on one venue even as leverage across the broader ETH futures market was already being reduced.
It does not show that all exchanges had the same positioning. Bitfinex may have reflected a concentrated group of traders, while the aggregate open-interest figure combines long and short contracts across multiple venues.
Bitfinex shorts kept rising after broader leverage peaked
The sharper move appears on the Bitfinex ETH/USD Shorts chart. The reading fell from roughly 97,500 ETH to 34,000 ETH, a decline of about 65% within an incomplete daily candle.
That is a substantial change in short exposure on Bitfinex. It does not measure total Ethereum short interest across the wider futures market.
The move may reflect profit-taking after ETH’s recent decline, lower leverage during a volatile session, or exchange-specific position changes. The gauge records the reduction in short exposure; it does not disclose the traders’ reasoning.
ETH’s pullback arrived during a wider risk-off session
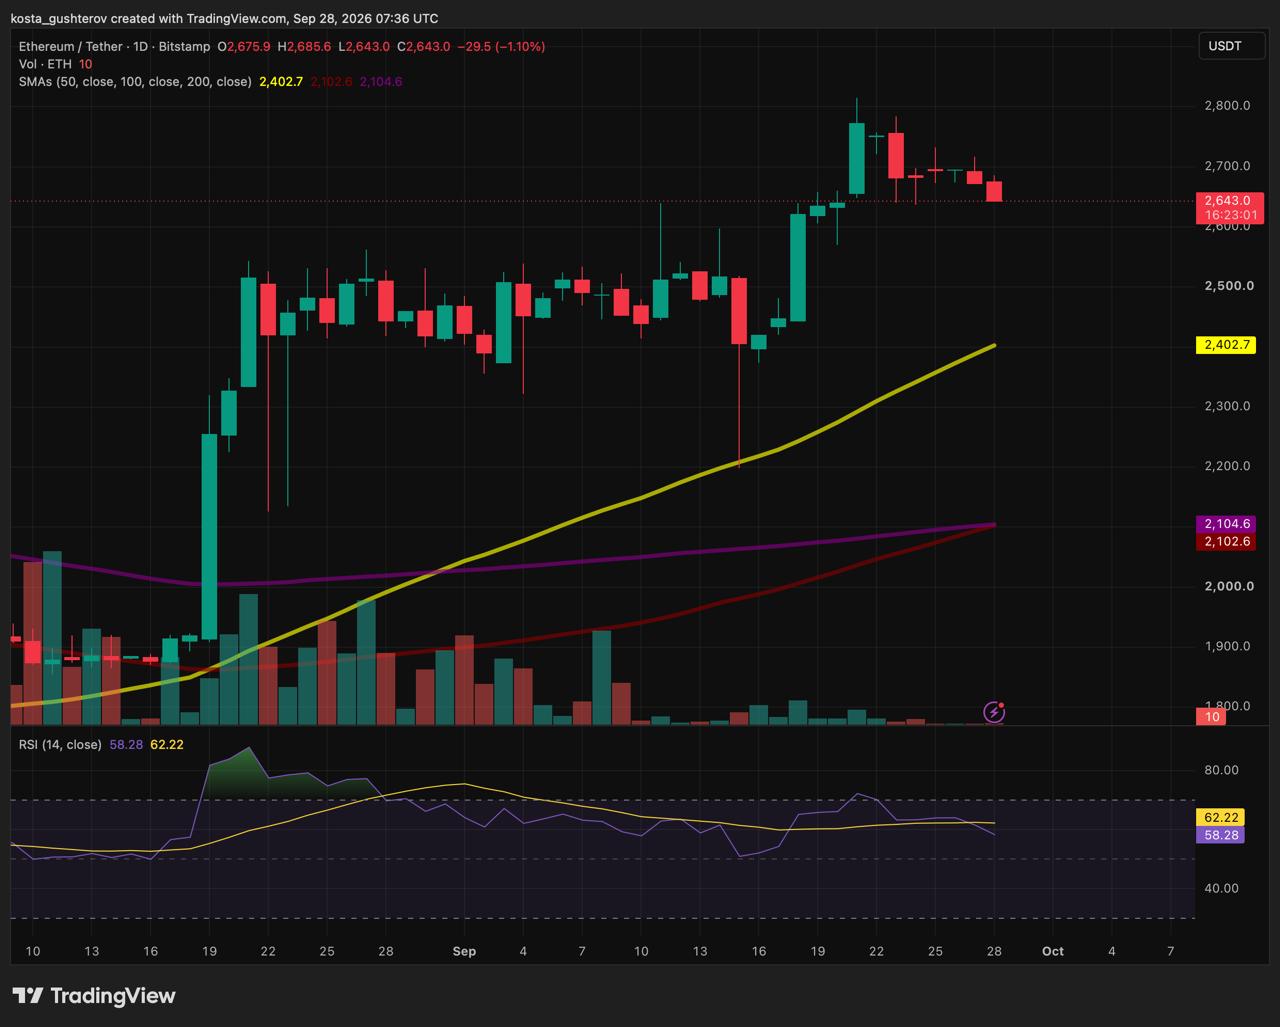
ETH traded near $2,650 at the time of writing, down about 2.4% over 24 hours according to CoinMarketCap data. The daily chart shows ETH retreating from its recent high near $2,800.
ETH’s pullback came as renewed U.S.-Iran tensions lifted oil prices and unsettled risk-sensitive markets. Bitcoin also pulled back as traders reassessed the Hormuz situation.
The sharp Bitfinex reading did not coincide with an ETH rally. Ethereum fell alongside the wider market, leaving little evidence of a broad short squeeze in price action. The position change may instead reflect profit-taking, reduced leverage or exchange-specific activity during a volatile session.
What a viral positioning call can change
A well-known historical example comes from Elon Musk’s posts about crypto. A 2023 study of his Twitter activity found links between crypto-related posts, abnormal short-term Bitcoin returns and trading volume. Musk’s reach is exceptional, so the research provides context rather than a model for every influential crypto account.
The evidence supports a narrower conclusion
The Bitfinex ETH/USD Shorts gauge fell sharply after a short-squeeze narrative became widely shared across Crypto X. Aggregate ETH open interest, however, had already been declining from its September 21 peak, while Ethereum fell during Monday’s broader risk-off session.
Crypto X may have changed how quickly some traders reconsidered bearish leverage. The evidence does not show that posts moved ETH or caused the reduction in positions. Establishing that claim would require matching changes across several exchanges, including funding rates, short liquidations, broader short exposure and price behaviour that clearly diverges from the rest of the market.
This article is provided for informational purposes only and does not constitute financial or investment advice. Social-media posts, derivatives metrics and technical charts are interpretive tools, not guarantees of future market movement.

Alex is Editor-in-Chief of Coindoo and co-founder of Millennial Media Group, with nearly a decade of experience covering financial markets – crypto first, then everything else.
It started in 2016 with Bitcoin. Like most people at the time, he didn’t fully understand it – so he kept digging. Blockchain, tokenomics, the projects, the cycles. That curiosity never stopped, and eventually pulled him into traditional markets too: equities, commodities, macro. Not because he left crypto behind, but because you can’t properly understand one without the other.
What drives him is straightforward: he wants to know why something is happening, not just that it’s happening. Most market coverage stops at the headline – price up, price down, here’s a chart. Alex finds that kind of reporting actively unhelpful. If you walk away from an article without understanding the mechanism behind the move, what did you actually learn?
He holds a degree in Tourism from New Bulgarian University – not the most obvious path into financial markets, but markets have a way of pulling in people who are simply too curious to stay out. He has authored over 200 in-depth analyses and more than 10,000 articles across crypto and traditional finance. He still thinks every day in markets teaches him something new. That’s probably why he hasn’t stopped.



Be the first to comment