



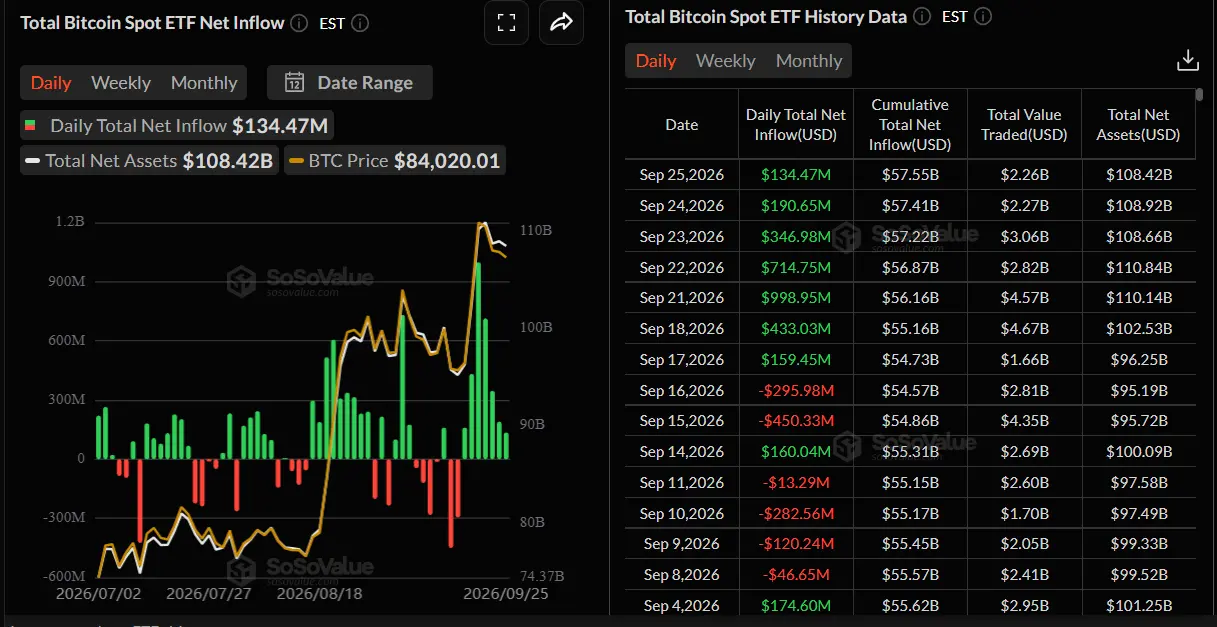
On September 28, Bitcoin ETFs saw $145.71 million in net inflows, keeping ETF activity in the spotlight as Bitcoin trades above $83,000 even amid short-term selling pressure.
As of press time, Bitcoin is trading at $83,598.82, a 1.03% decline over the last 24 hours. The newest ETF data adds a significant layer to the market picture, since Bitcoin continues to trade above its key technical levels while derivatives activity stays elevated.
Also Read: Bitcoin ETFs Add $1.7B in Two Days as BTC Breaks Higher
Bitcoin ETF Inflows Keep Market Demand in the Spotlight
Per Lookonchain, Bitcoin ETFs recorded 1,740 BTC, valued at $145.71 million, in net inflows over a single day. The seven-day total was much higher, hitting 29,298 BTC, or roughly $2.45 billion.

Lookonchain’s update specifically showed: “1D NetFlow: +1,740 $BTC (+$145.71M)” and “7D NetFlow: +29,298 $BTC (+$2.45B)”
The scale of the weekly inflow helps put the latest daily figure into context. Instead of being an isolated session, the seven-day data indicates that Bitcoin ETF flows remained positive over the seven-day period covered by the update.
This matters for the market because spot ETF activity offers another gauge of demand around Bitcoin. The data does not prove that every inflow reflects new institutional buying, but sustained positive flows keep investor participation in focus while BTC holds above $80,000.
Based on the details provided by SoSoValue, Bitcoin ETF flows remain in focus, with the latest figures showing continued activity across spot Bitcoin ETFs. This information adds further context to the $145.71 million in daily inflows recorded by Lookonchain and highlights the role of ETF flows in the broader Bitcoin ecosystem.
Also Read: Bitcoin Price Eyes 3–5x Gain as Bitcoin ETF Holders Return to Profit
What Does the Bitcoin ETF Flow Mean for BTC Price?
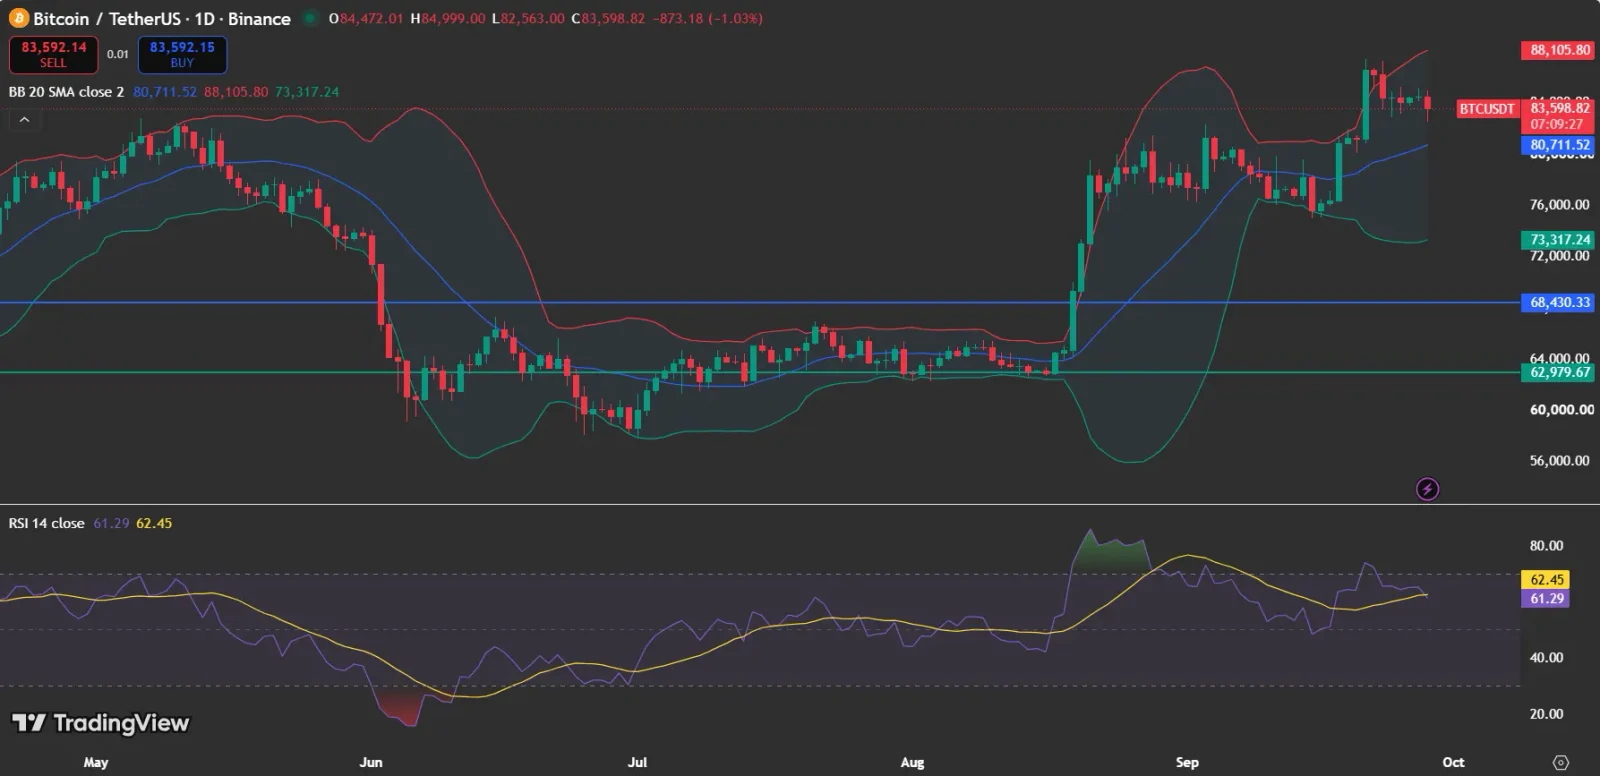
The TradingView daily chart shows Bitcoin trading at $83,598.82, with the price sitting above the $80,711.52 middle Bollinger Band.
At present, the upper Bollinger Band sits at $88,105.80, whereas the lower band is positioned at $73,317.24. As a result, Bitcoin is still trading in the upper portion of the indicator’s range, even though the most recent daily candle reveals some selling pressure.
The RSI is at 61.29, and its moving average is at 62.45. This suggests that momentum is still above the neutral 50 mark but has yet to enter the widely monitored 70 overbought territory.
With price holding above the middle Bollinger Band and RSI above 60, the chart displays a fairly solid momentum structure. Nevertheless, for Bitcoin to show stronger upward momentum, it would need to advance toward $88,105.80 and eventually break above that level.
Also Read: Bitcoin ETF Inflows Hit $160M as BTC Price Eyes $83,000 Breakout
How Does Bitcoin ETF Activity Compare With Derivatives?
Data from CoinGlass offers further context. Around September 27, Bitcoin open interest stood near $54.5 billion, after a notable rise during the period displayed on the chart.
The open-interest chart reveals positioning climbing sharply in August and again in late September as Bitcoin approached the $80,000-$85,000 range. This suggests that derivatives activity continues to be substantial alongside the spot market.
Bitcoin’s trading volume has likewise stayed active. The CoinGlass volume chart displays multiple elevated volume periods in September, including a prominent spike around September 22-23 as Bitcoin pushed higher.
The derivatives data cannot tell us whether Bitcoin will go up or down next. Rather, it indicates that traders are still engaged in the market, which makes shifts in open interest and volume key signals to track alongside ETF flows.
What Should Bitcoin ETF Traders Keep an Eye On Next?
The next thing to watch is whether Bitcoin can hold its position above the middle Bollinger Band while ETF flows stay positive. Traders can also keep an eye on open interest and volume for shifts in derivatives participation as BTC nears the upper Bollinger Band.
The $80,711 support zone and the $88,105 resistance zone offer clear technical reference points based on the supplied TradingView data. A sustained break outside this range could offer more clarity on where Bitcoin heads next.
At present, the market is showing two conflicting signals: Bitcoin has declined 1.03% over the past 24 hours, yet ETF flows remain positive, with Bitcoin ETFs recording $2.45 billion in net inflows over seven days.
Cryptocurrency markets are still highly volatile, and traders should keep an eye on price action, market sentiment, and upcoming catalysts before making any investment decisions.
Also Read: Spot Bitcoin ETFs Bleed $283M in Massive Third-Day Slump
This article contains market analysis and price predictions. These are not guarantees. Crypto markets are volatile. Always DYOR. Not financial advice.



Be the first to comment