


Worldcoin price has climbed toward $0.60 as strengthening momentum puts a larger recovery pattern back in focus.
Summary
- Worldcoin price traded near $0.567, with the daily chart showing a gain of roughly 12%.
- A rounded recovery on the daily chart places $0.7216 as the broader resistance level.
- The 4-hour chart shows an immediate hurdle around $0.59–$0.60 after a sharp rebound.
- CoinGlass liquidation estimates show nearby clusters around $0.57–$0.58 and $0.55.
TradingView’s Binance WLD/USDT daily chart showed Worldcoin trading at $0.5672 on Oct. 2, up 12.05% from the daily opening price. The token reached an intraday high of $0.5901 after touching a low of $0.5009.

The advance brought WLD back toward its late-September highs following a pullback toward $0.48. Buyers recovered much of that decline, although the retreat from the intraday peak left the token below the nearby $0.60 barrier.
Worldcoin’s daily recovery points toward $0.72 resistance
The daily chart shows a rounding bottom pattern taking shape, with the August low near $0.30 forming its base and the June high at $0.7216 marking neckline resistance.
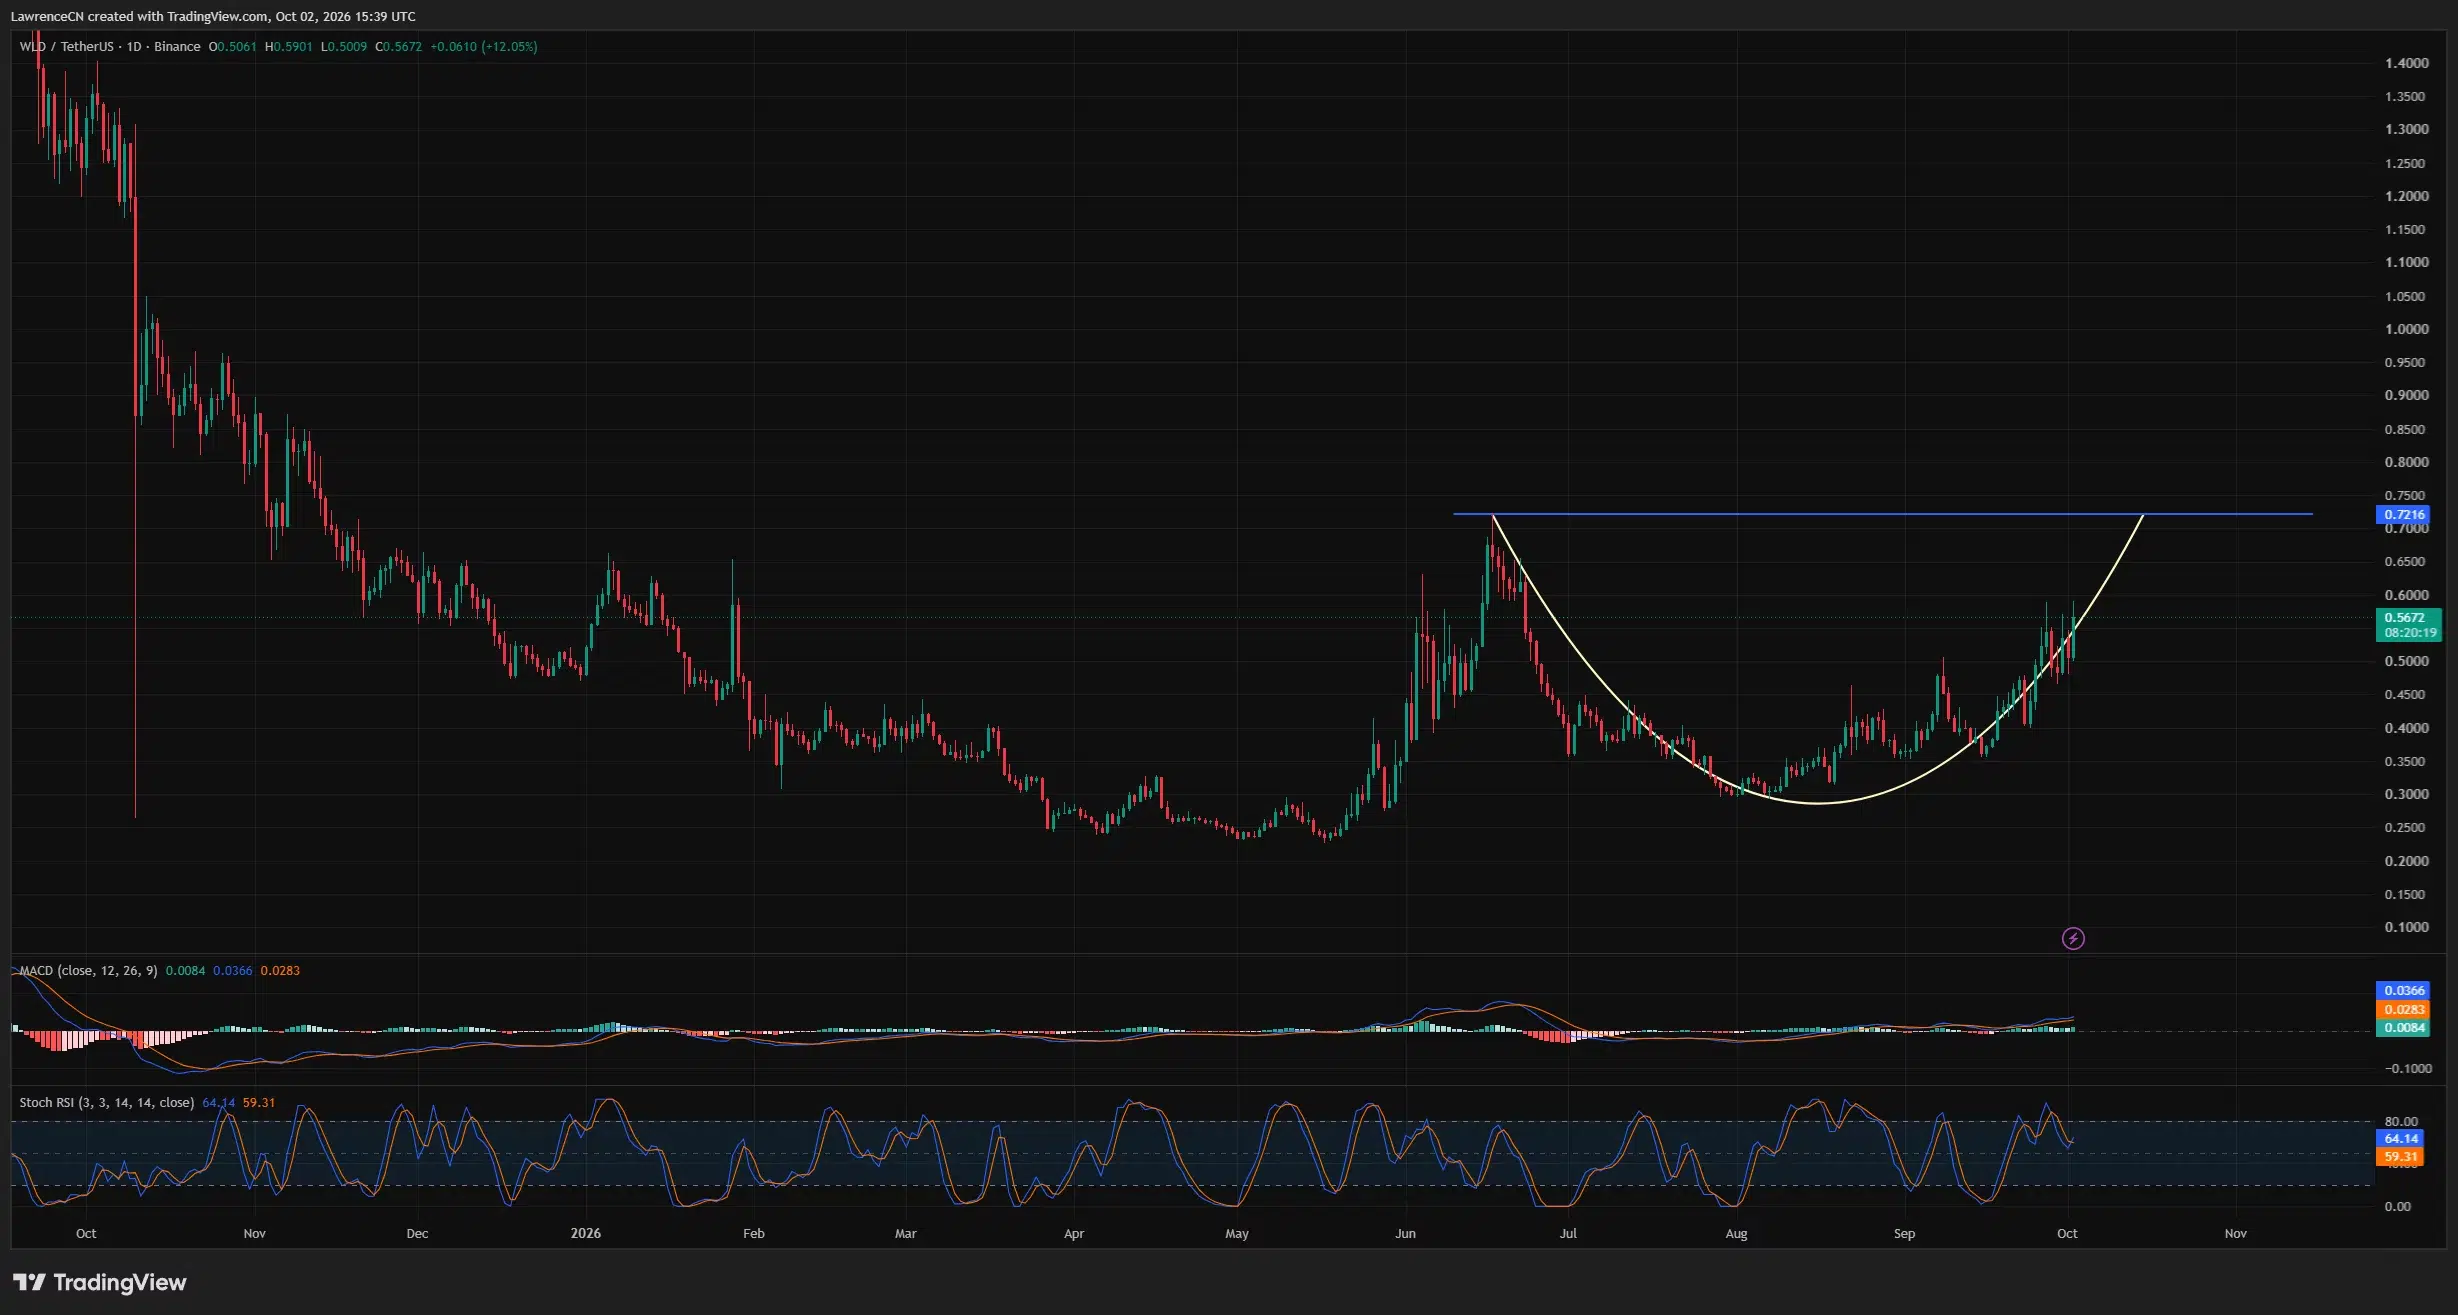
September’s pullbacks held above the August trough, while the latest advance carried WLD back above $0.50. The right side of the rounded formation has consequently extended toward the earlier trading range around $0.60.
The horizontal resistance marked at $0.7216 sits near the June high and forms the upper boundary of the recovery pattern. From $0.5672, a return to that level would represent an advance of approximately 27%.
However, the daily chart has yet to show a completed breakout above that boundary. The rounded formation remains a developing recovery setup, with $0.59–$0.60 standing between the current price and the larger resistance zone.
Daily momentum readings favor buyers. The moving average convergence divergence indicator showed its MACD line at 0.0366, above the signal line at 0.0283, with a positive histogram reading of 0.0084.
Both lines were also above zero, supporting the bullish momentum visible in the recent price advance. A narrowing histogram or a crossover below the signal line would weaken that momentum signal.
The Stochastic RSI showed readings of 64.14 and 59.31, with the faster line above the slower line. Both remained below the indicator’s 80 threshold, although they had eased from earlier elevated readings.
Together, the daily indicators support the recovery attempt without establishing a breakout above the June high. On the price chart, $0.50 is the nearest round-number support, followed by the recent trading area around $0.48.
The 4-hour chart puts $0.59–$0.60 in the way
TradingView’s 4-hour chart showed WLD at $0.5678 after reaching the same $0.5901 intraday high. The rebound lifted price back toward an upward-sloping resistance line drawn across the broader July-to-October trading structure.
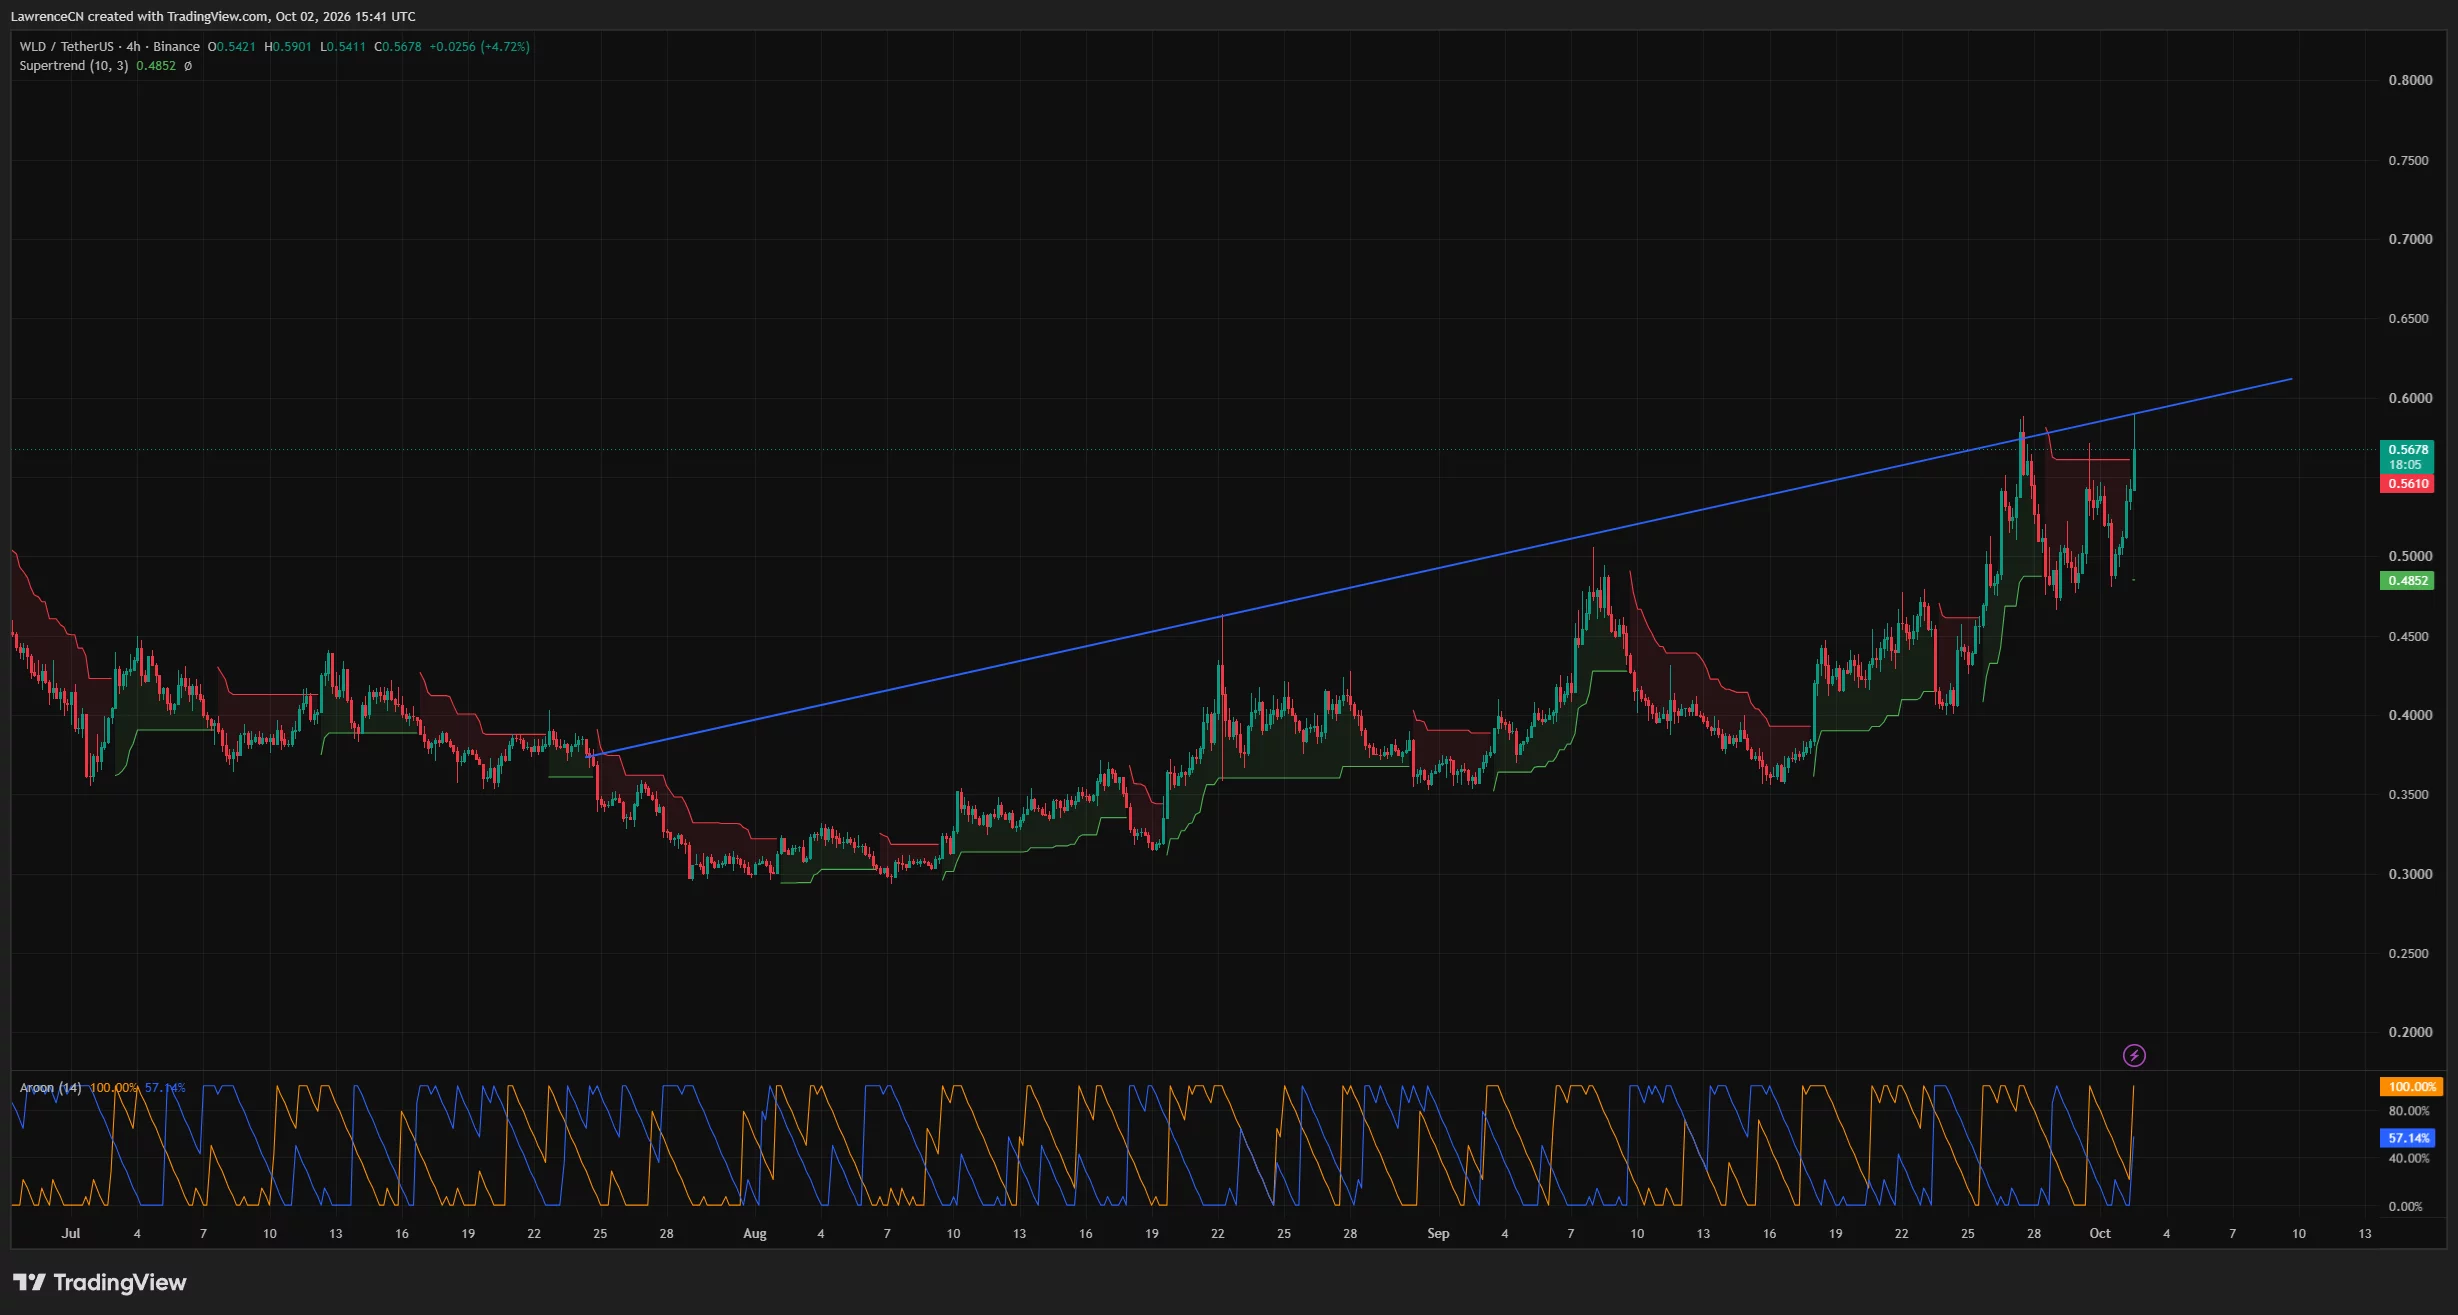
That line passes through the latest price region around $0.58–$0.59 and rises toward $0.60. WLD’s earlier late-September advance also encountered selling near the line before retreating toward $0.48.
The latest test therefore places price at an established technical hurdle. Sustained trading above $0.59–$0.60 would strengthen the case for extending the recovery, while another rejection would leave the recent highs intact as resistance.
The 4-hour Supertrend displayed a green support reading at $0.4852, well below the current price. WLD remained above that level after recovering from the latest pullback.
A move back toward $0.50 would bring the token closer to the Supertrend support and the recent swing-low region. A break below approximately $0.485 would weaken the shorter-term recovery structure.
The Aroon indicator showed Aroon Up at 100% and Aroon Down at 57.14%. The higher upward reading reflects a fresh high within the indicator’s lookback period, while the downward reading retains the effect of the recent selloff.
Analyst Alex Marzell’s Oct. 2 commentary identified $0.53 as support after WLD rebounded from $0.481. He projected a test of $0.571 if $0.53 held and $0.55 gave way, while a loss of support could bring $0.50 back into view.
WLD subsequently moved through $0.55 and reached beyond his $0.571 level before easing toward $0.567. His $0.53 support remains a nearer downside reference ahead of the $0.50 region.
Liquidation clusters surround the latest rebound
CoinGlass’s three-day liquidation heatmap shows WLD recovering from roughly $0.48 on Oct. 1 toward $0.59 on Oct. 2. Price crossed several concentrations of estimated liquidation exposure during that advance.
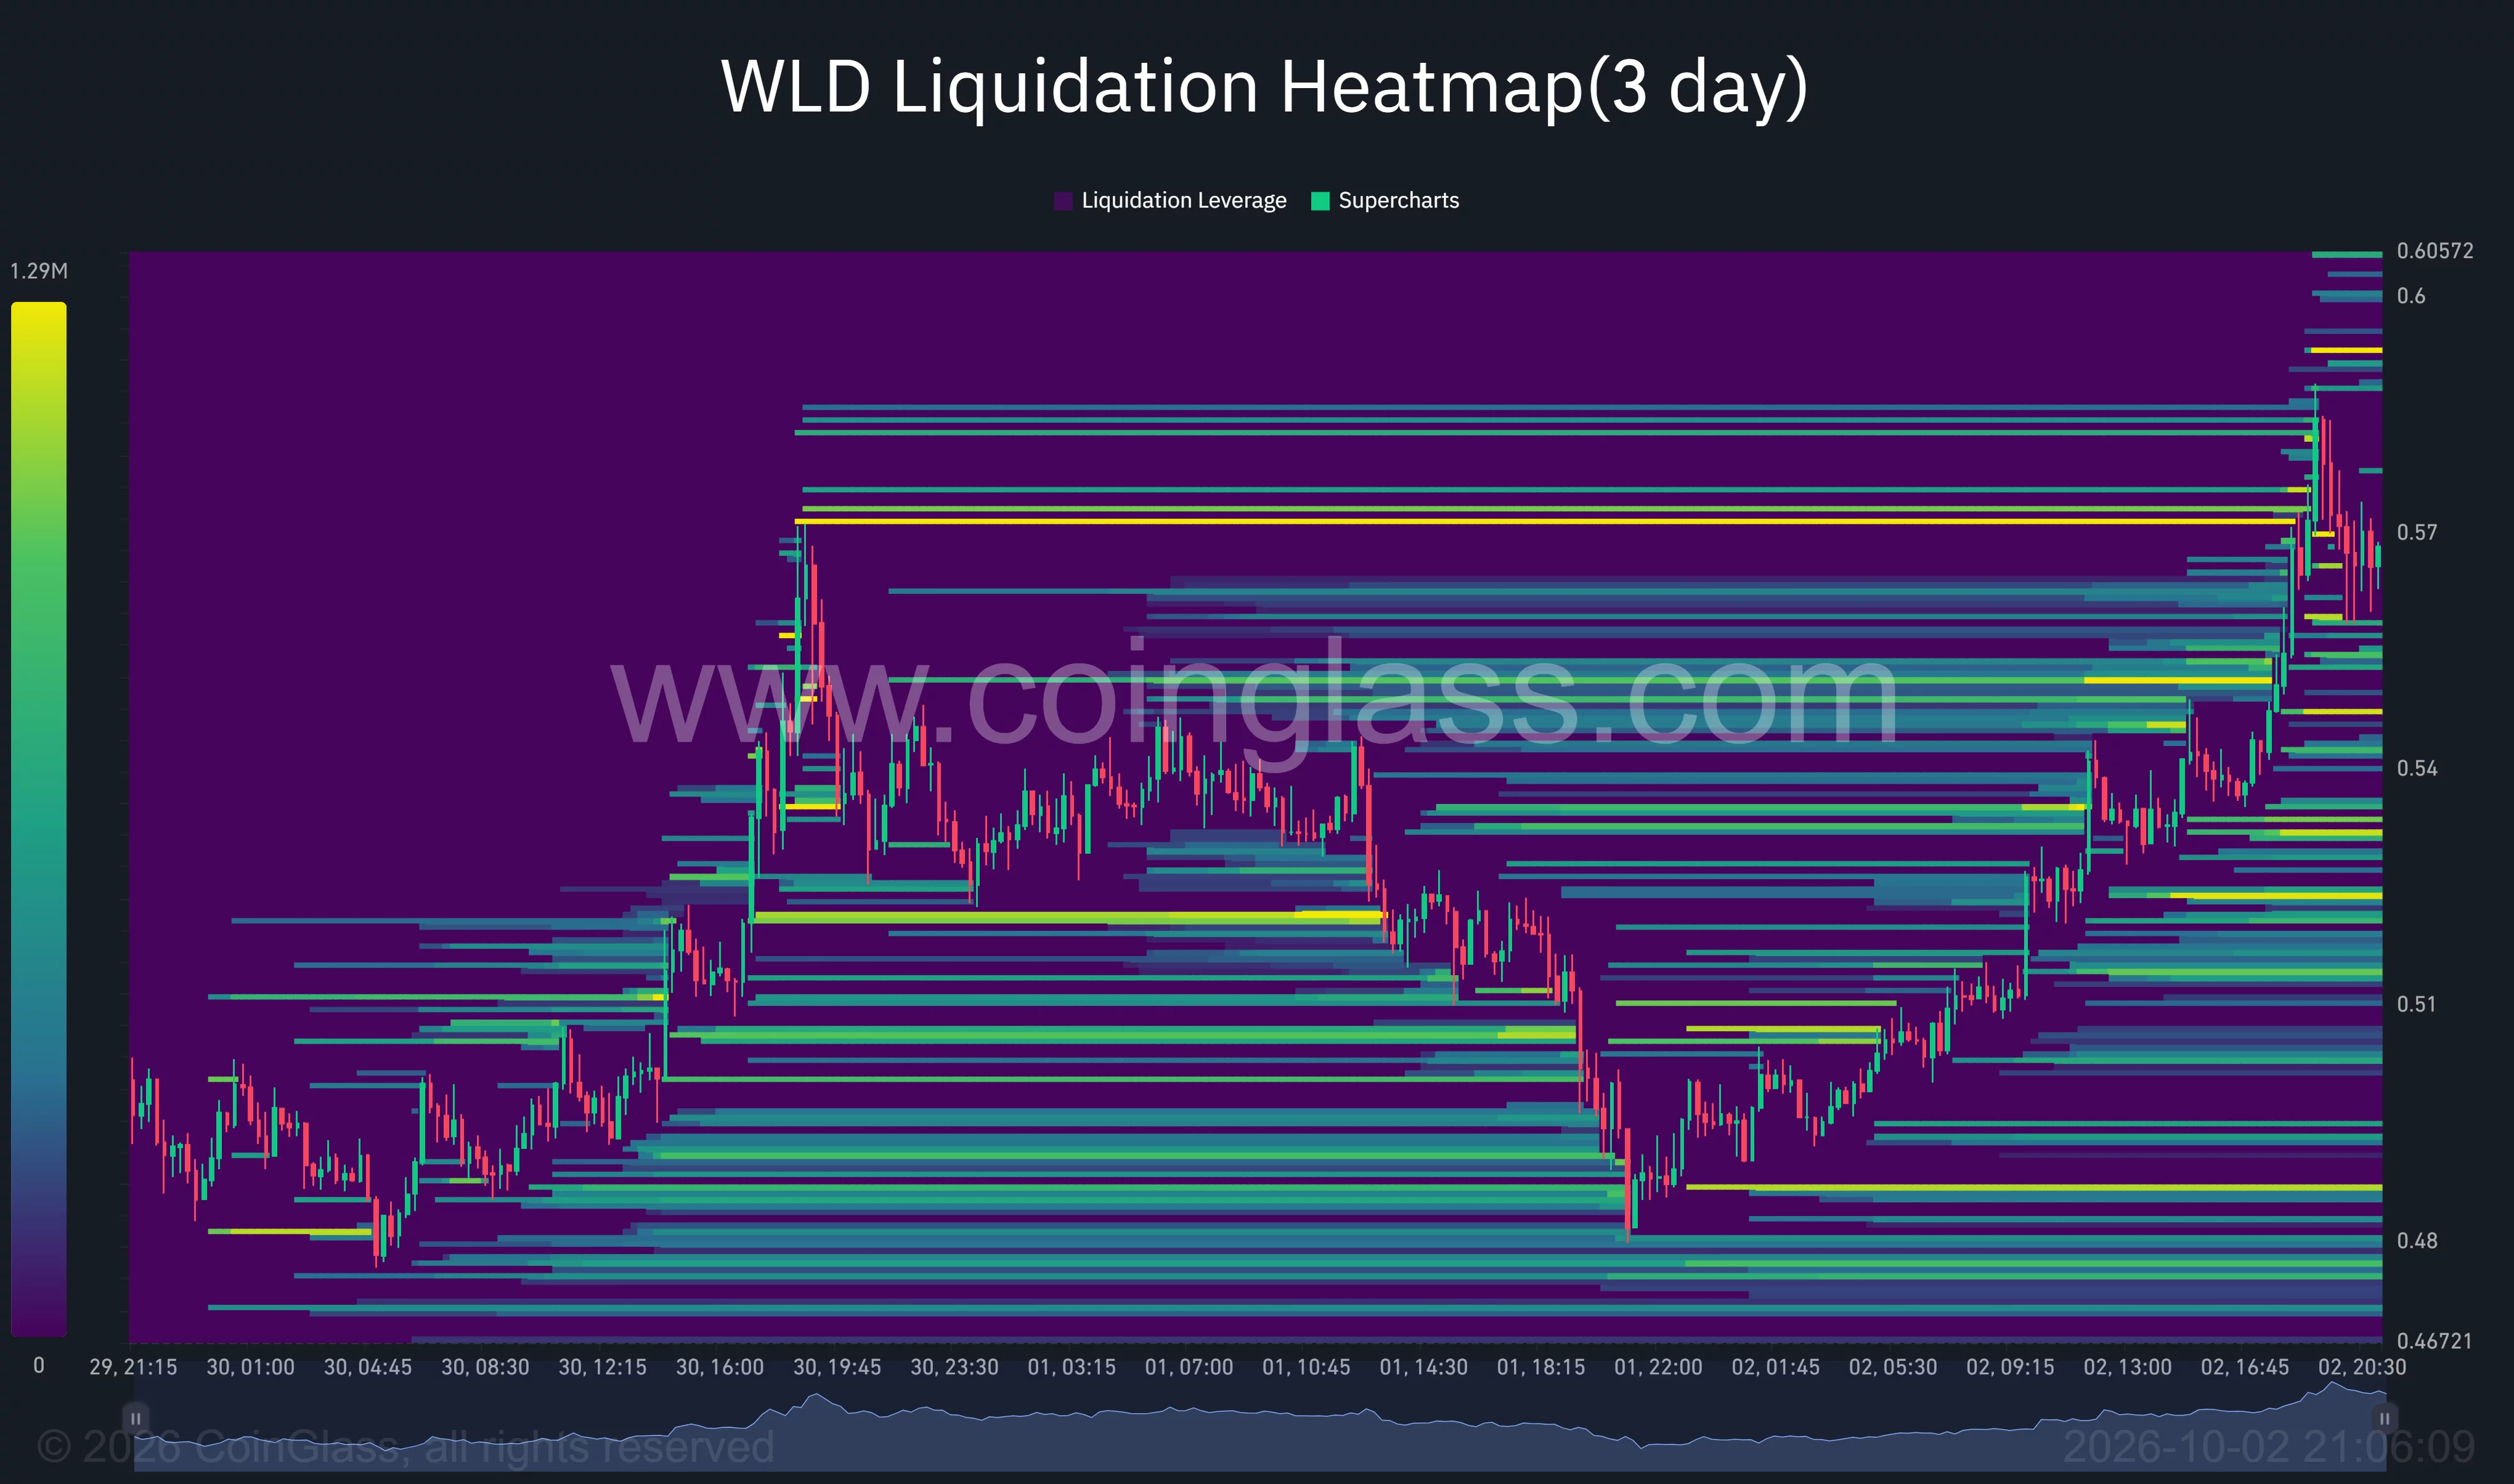
Near the latest price, visible bands sit around $0.57–$0.58, with additional overhead concentrations near $0.59–$0.60. A further advance through those areas could expose short positions to liquidation, depending on their leverage and entry prices.
Below the market, clusters appear around $0.55 and approximately $0.53–$0.535. Those levels overlap with the trading areas WLD crossed during its latest climb and Marzell’s identified support.
Deeper concentrations remain near $0.52 and $0.49. A reversal through the nearer bands could expose leveraged long positions as price moves back toward those lower levels.
The heatmap charts estimated liquidation exposure rather than completed liquidations. Its visible clusters identify areas where forced position closures could accompany another sharp move, without determining which direction price will take.
Slower WLD unlocks provide longer-term supply context
World’s token schedule provides a separate backdrop to the recovery. The project announced that aggregate daily unlocks would fall by approximately 43% on July 24, 2026, from about 5.1 million WLD to 2.9 million WLD.
The scheduled change reduced community unlocks from 3.2 million to 1.6 million tokens per day and team and investor unlocks from 1.9 million to 1.3 million. Tokens continue unlocking daily, so the lower rate reduces new unlocked supply without ending it.
World also announced its U.S. launch in May 2025, beginning in six cities, including San Francisco, Los Angeles and Miami. The expansion connects the project’s human-verification services to the U.S. technology market, although that earlier launch is separate from WLD’s latest trading move.
For the immediate price outlook, the chart-based hurdle remains $0.59–$0.60. Clearing that region would strengthen the developing daily recovery toward $0.7216, while a retreat below $0.53 would put $0.50 and the 4-hour Supertrend near $0.4852 back in focus.
Disclosure: This article does not represent investment advice. The content and materials featured on this page are for educational purposes only.



Be the first to comment