



SAND surged roughly 52% on October 2 after Korean exchanges lifted trading warnings, but its retreat from the high leaves buyers facing an early test.
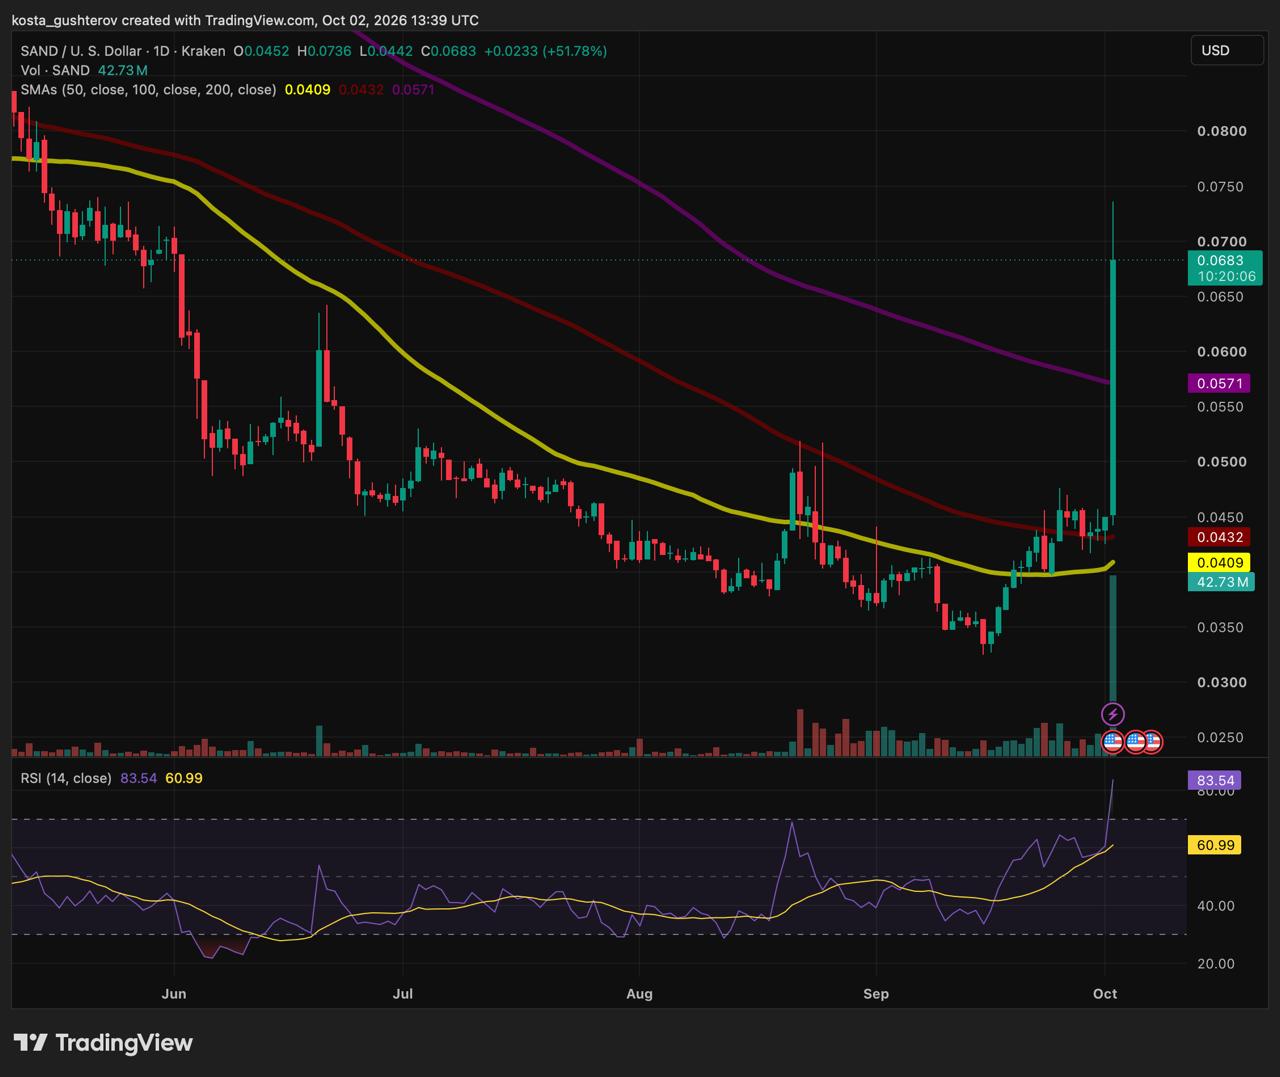
SAND briefly reached $0.0736 on October 2, about 63% above its daily opening price on Kraken. By 13:39 UTC, it had retreated 7.2% to around $0.0683, leaving the still-unfinished session with a gain of roughly 52%.
Despite that retreat, SAND remained above the levels that had stopped earlier rebounds. The next pullback will test whether buyers are willing to defend those areas at higher prices.
The first potential support sits near $0.060
The $0.060–$0.062 area, near the June rebound, is the first horizontal zone beneath price to watch. Today’s surge cleared it, but buyers have yet to defend it during a subsequent pullback.
Returning to the bottom of that zone would mean a decline of roughly 12% from $0.0683. Such a move could preserve much of today’s advance while still producing a substantial loss for someone buying after the surge.
| Potential support | Chart reference |
|---|---|
| $0.060-$0.062 | Area around the June rebound, cleared during today’s surge. |
| $0.050-$0.052 | Previous rebound area around July and August highs. |
| $0.044-$0.046 | Recent consolidation around today’s opening price. |
Between the first two horizontal zones sits the 200 SMA near $0.0571. Today’s surge carried SAND above this still-falling average, and holding above it through the daily close would add weight to the breakout. Its position changes as new daily closing prices enter the calculation.
If SAND closes below $0.060 and cannot recover it, the 200 SMA would become the next reference beneath price. A sustained break below that average would leave $0.050–$0.052 as the next horizontal area to monitor.
The 100 SMA near $0.0432 and 50 SMA near $0.0409 sit much lower. SAND was already above both before today’s surge, so those averages offer little guidance on whether the latest retreat has finished.
RSI reflects the speed of the advance
The daily RSI was near 83.5, above the conventional overbought threshold of 70. Because it compares recent gains with losses, the reading shows how quickly buying accelerated, without establishing when that strength will fade.
RSI can fall as price consolidates without ending a recovery. For SAND, weaker rebounds accompanied by breaks below support would provide a more useful warning than the elevated reading alone.
Korean exchanges lifted SAND’s trading warnings
The surge coincided with a change in SAND’s status on Korean exchanges. Coinone lifted its trading-caution designation and announced the resumption of deposits and withdrawals for 16:00 KST, or 07:00 UTC, on October 2.
The decision followed the wider altcoin strength covered in our October 1 review of the broadening rally. That provided a favourable market backdrop, while the exchange announcements offered a development specific to SAND.
SAND is used within The Sandbox’s virtual-world economy, including purchases of digital assets and participation in governance. The restrictions affected how holders could move that token between their wallets and exchanges. Their removal improves access without establishing an increase in spending by players or creators.
Coinone had imposed the warning following an August 22 security incident that caused user harm. It said explanations from the project and publicly available materials had resolved the grounds for the designation.
Bithumb also removed its warning and scheduled transfers to resume at the same time, subject to operational changes. Upbit said SAND deposits would reopen shortly after lifting its designation. Those decisions could ease concerns about the token’s standing on the exchanges, offering a plausible explanation for renewed buying.
SAND was already trading on these platforms. Coinone’s earlier notice stated that spot trading continued during the transfer suspension, so today’s changes restored token movement and removed the warning attached to an existing market.
Restored deposits also let holders move SAND onto exchanges to sell. Buyers therefore need to absorb any additional supply that arrives, even as the warning removal improves confidence. The effect on price depends on both sides of that trade.
Futures activity could amplify the swings
On October 2, CoinGlass showed roughly $884 million in SAND futures turnover over the preceding 24 hours, compared with $155.6 million in spot trading. Futures turnover was about 5.7 times larger, while approximately $4.4 million in futures positions were liquidated, and most of them were shorts.
That activity leaves room for leveraged positions to amplify price swings.
For now, defending $0.060–$0.062 during a pullback and recovering $0.070 would strengthen the case for another attempt at the $0.0736 high. If rebounds instead stall below lost support, the initial response to the news would have failed to produce buying strong enough to maintain the higher prices.
This article is for informational purposes only and does not constitute investment advice. Prices and technical levels reflect the chart at 13:39 UTC on October 2, 2026, and may change.

Kosta has reported on cryptocurrency markets and blockchain infrastructure since 2020, bringing over six years of hands-on experience in the crypto industry built through daily tracking of markets, trends, and emerging blockchain developments. Specializing in Bitcoin on-chain analysis, institutional ETF flows, and digital asset price action, his work at Coindoo has been cited by other news agencies and consistently covers market developments with a focus on data-driven reporting across Bitcoin, Ethereum, Solana, and XRP.
Over the years, Kosta has contributed to multiple crypto media outlets in different regions, authoring over 6,000 articles across the sector. His reporting spans cryptocurrency markets and the broader fintech industry, tracking not only price action but also the technological and regulatory forces shaping the ecosystem.
To support his analysis, Kosta actively leverages on-chain data and metrics from leading platforms such as Santiment, Glassnode, and CryptoQuant, enabling deeper, evidence-based market insights. He believes in the power of transparency and the data that underpins the blockchain ecosystem.
His academic background in Marketing Management from Denmark further complements his analytical approach, adding a strong understanding of communication strategy and content positioning to his work.


Be the first to comment