


What to know:
- Solana (SOL) has rebounded from recent dips, currently testing critical resistance levels in the market.
- Technical indicators suggest that low buying momentum persists, while selling pressure continues to influence the SOL price.
- A decisive breakout above key resistance could spark significant upward momentum for Solana’s short-term trend.

Solana (SOL) is showing to rise from its recent dips and regaining key resistance levels in the cryptocurrency market. However, technical indicators indicate that purchasing pressure is still relatively low, and sellers are still around. A breakout for Solana will determine if it will gain momentum for a stronger uptrend, according to market observers.
At the time of writing, Solana (SOL) is trading at $84.26 with a trading volume of $5.65 billion over the last 24 hours. Its market capitalization is $48.39 billion. According to CoinMarketCap, SOL is up by almost 2.75% over the past 24 hours, indicating optimism among investors and crypto enthusiasts monitoring the market today.
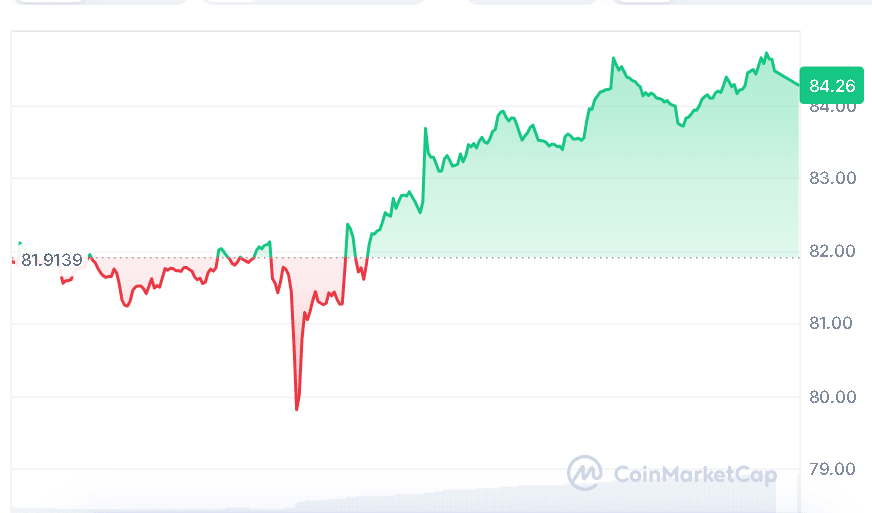

Source: CoinMarketCap

Solana Rebounds Amid Key Resistance
On March 30, 2026, a well-known crypto analyst, BitGuru, pointed out that the SOL price had bounced from a key reversal zone, having touched lower levels after dipping below significant support levels.
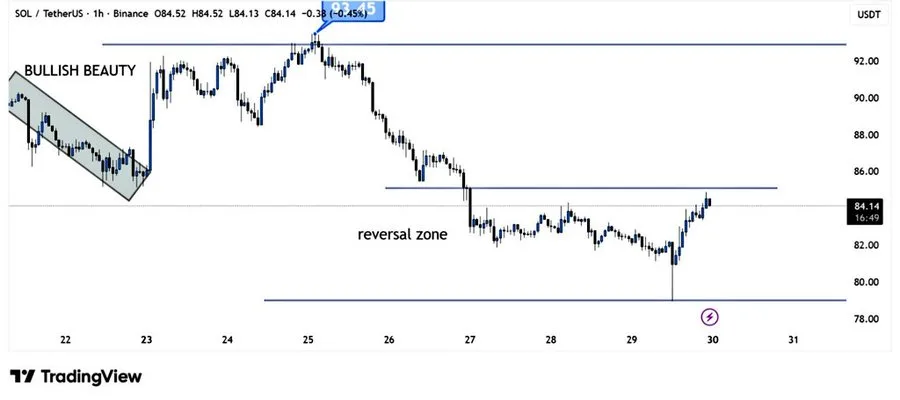

Source: BitGuru’s X Post
According to BitGuru, if the price manages to move above this resistance, there is a possibility that the momentum could shift in favor of the buyers in no time. The opinions of BitGuru should not be taken as financial advice.
Technical Indicators Show Caution
Although the price of SOL has increased, the momentum is still low. The Relative Strength Index (RSI) of SOL is currently at 33.71, which is lower than the signal line at 34.07. This indicates limited buying strength and suggests that the market remains in oversold territory.
The moving average ribbon continues to maintain its position well above SOL’s current stock price, with values ranging from 108.64, 151.16, 159.94, and 104.30. This further confirms that the general trend of the stock is still bearish.
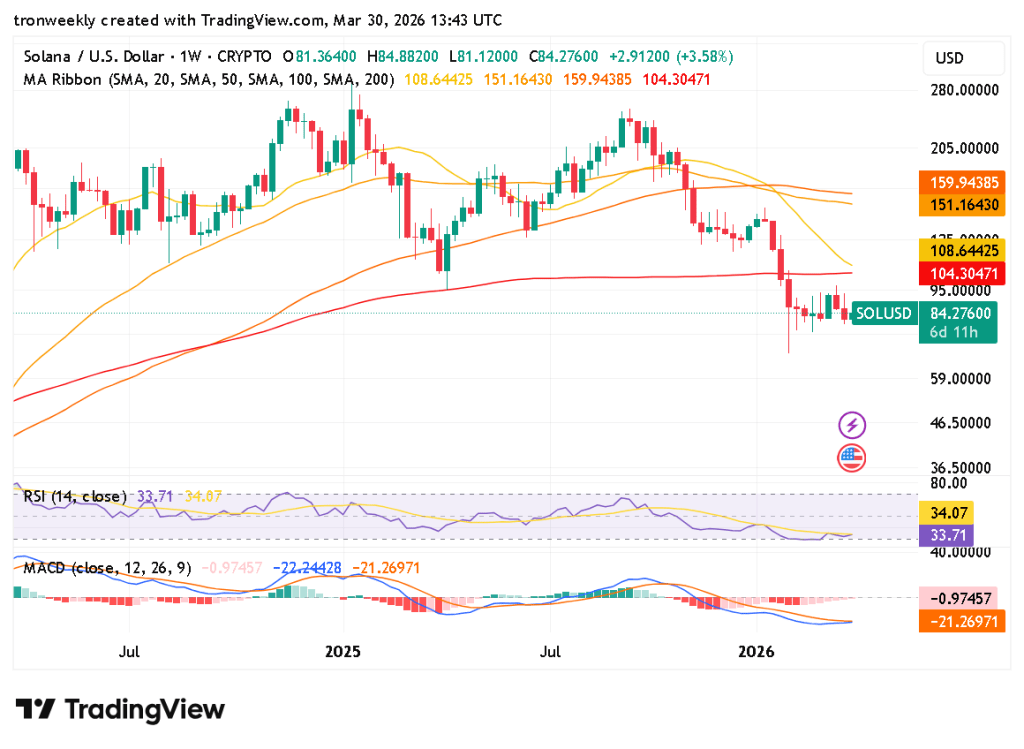
Source: TradingView
In addition, the MACD value is still in the negative zone, ranging from -0.97 to -21.26, and the MACD line is still in the lower position compared to the signal line. This confirms that the selling pressure is still dominating, and a strong stock reversal is yet to happen.
Also Read | Solana Pullback Intensifies, $60–$65 Fibonacci Zone Emerges Key Support
What Could Drive Solana Higher?
SOL price needs to break through resistance levels decisively to continue its upward trend. This will attract more buyers and change its short-term trend. Analysts are watching this price level to see if SOL will continue its upward trend or be further weakened by sellers.
While Solana’s technical indicators advise caution, Solana is also showing signs of gaining footing following its recent declines. Investors are waiting for Solana’s momentum to increase in order for the rally to be complete. Investors should do their own research before investing in any cryptocurrency.
This article contains market analysis and price predictions. These are not guarantees. Crypto markets are volatile. Always DYOR. Not financial advice.
Also Read | Bitcoin Weakens as On-Chain Data Signals Drop Toward $46,000–$54,000

Be the first to comment