



Is the Fed back on the warpath? “Uptober” has hit its first speed bump. A hawkish set of Fed minutes and the highest Treasury yields in 24 years sent Bitcoin back towards $80,000, wiping out more than $1bn in leveraged bets along the way.
Add a $93m hardware wallet scandal to the mix, and it’s been a week to keep your guard up.
Here are the top stories you need to know:
Headlines of the week
- Bitcoin fell 3.27% this week to around $83,700, sliding from a Monday high of $86,974 to a low of $80,329 on 8th October, a peak-to-trough drop of roughly 7.6%.
- Fed minutes showed most officials favour another hike before year-end, while the 10-year Treasury yield touched 5.36%, its highest level since 2002.
- US spot Bitcoin ETFs posted $678.9m in net outflows between 5th and 9th October, ending a three-week inflow streak, with Fidelity’s FBTC (‑$380.3m) and ARK 21Shares’ ARKB (‑$207.2m) leading redemptions. Ethereum ETFs lost a further $542.2m.
- Saylor says there’s “always room for more orange”, but Strategy’s appetite was more snack than feast this week: just 250 BTC (~$21.5m), its smallest purchase of 2026. That takes its stack to 848,250 BTC, with $192.4m going on STRC share buybacks instead.
- Securitize launched 1:1-backed tokenised US stocks on Solana, starting with names including Apple, Nvidia and Strategy, as the value of stocks held onchain passed $3bn.
The Fed turns hawkish again
Last week’s soft data had traders betting the Fed was done. This week’s minutes from the September meeting suggested otherwise. All officials backed September’s hike, and most said another increase would likely be appropriate before the end of the year, pointing to energy costs and AI investment as inflation risks.

Bond markets felt it first. The 10-year Treasury yield touched 5.36% on Wednesday, its highest level since 2002, while the 30-year reached around 5.67%. With Brent crude back near $106 a barrel amid the ongoing Iran conflict, “higher for longer” is starting to look like the base case.
For now, an October hike looks unlikely, with markets pricing the odds at around 17% to 20%. December is now the meeting to watch, and September’s CPI print will go a long way to deciding how hawkish the Fed gets from here.
Leverage gets flushed out

Crypto took the news badly. Bitcoin slid from near $87,000 on Tuesday to $80,329 on Thursday, while Ether fell more than 6% to around $2,400 and Solana dropped nearly 9% to about $106. More than $1.1bn of positions were liquidated in 24 hours, with longs making up roughly $1.05bn of that.
ETF investors headed for the exits too. Bitcoin and Ethereum funds shed around $1.22bn combined, with 7th October alone accounting for roughly $646m. Solana ETFs also saw net redemptions, ending a 14-week inflow streak.
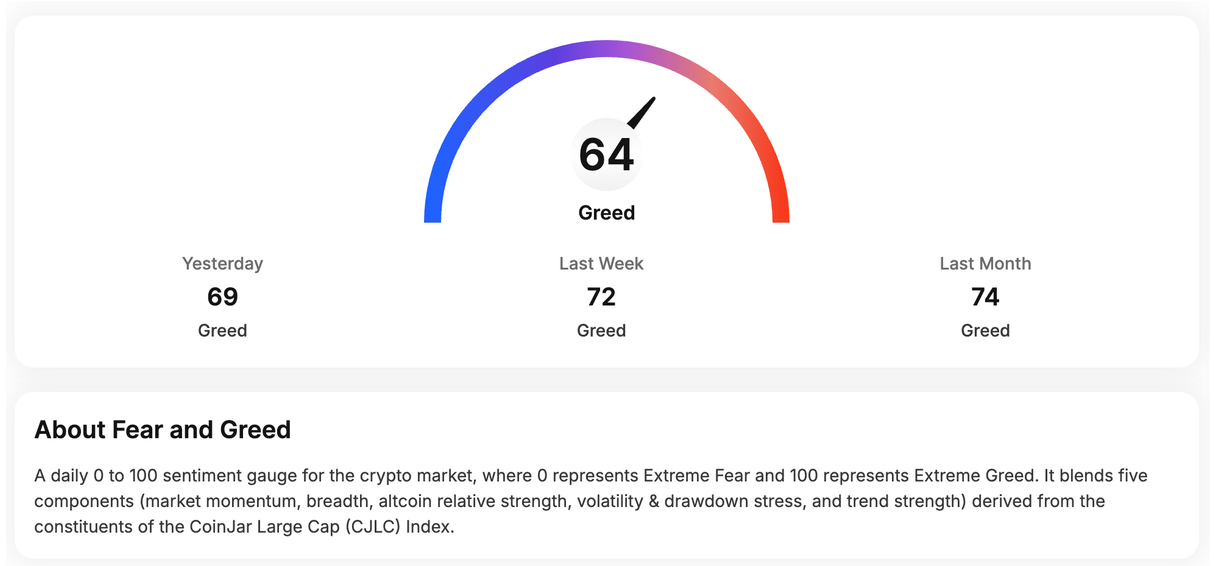
However, Bitcoin held the $80,000 mark, a level that roughly matches the average cost basis of ETF holders. Even at the low point, the Fear & Greed Index never slipped into fear, which suggests this was a leverage flush rather than a full-blown panic.
A $93m wallet scare
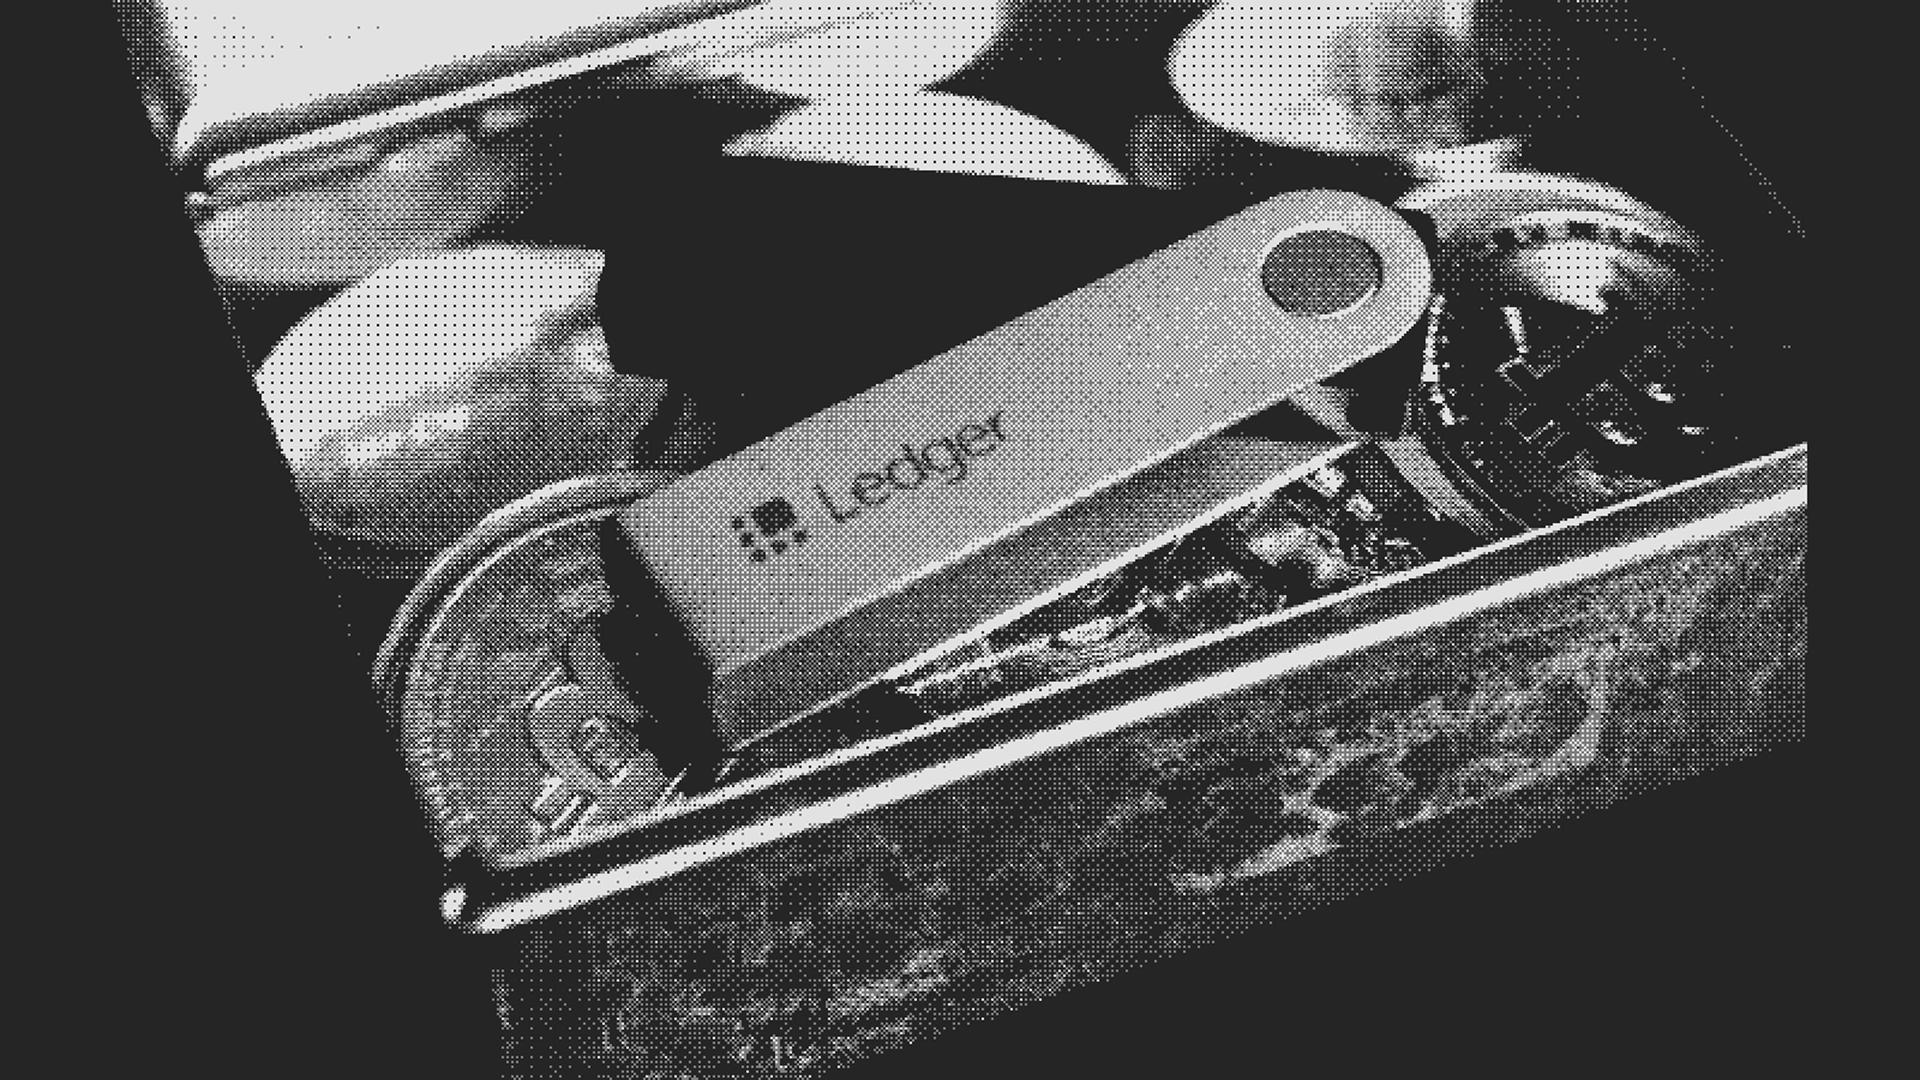
Hardware wallets are supposed to be the safest place to keep your crypto. This week, Ledger confirmed that a device sold through CryptoBilis, a reseller in Southeast Asia, contained an unauthorised hardware implant. On-chain researchers estimate losses from the resulting wallet drains at more than $93m.
The tampered devices still passed Ledger’s Genuine Check, because the security chip itself was real. Ledger says its own systems and direct sales channels weren’t compromised, and has told anyone who bought from CryptoBilis to move their funds to a new device bought directly from Ledger, using a fresh seed phrase. The lesson is simple: buy hardware wallets from the manufacturer or an authorised seller, and never share your recovery phrase with anyone.
Final takeaway: The Fed isn’t done yet, leverage got punished, and wallet security starts with where you buy your device.
Caleb for CoinJar
CoinJar on TradingView – Our top analysis this week
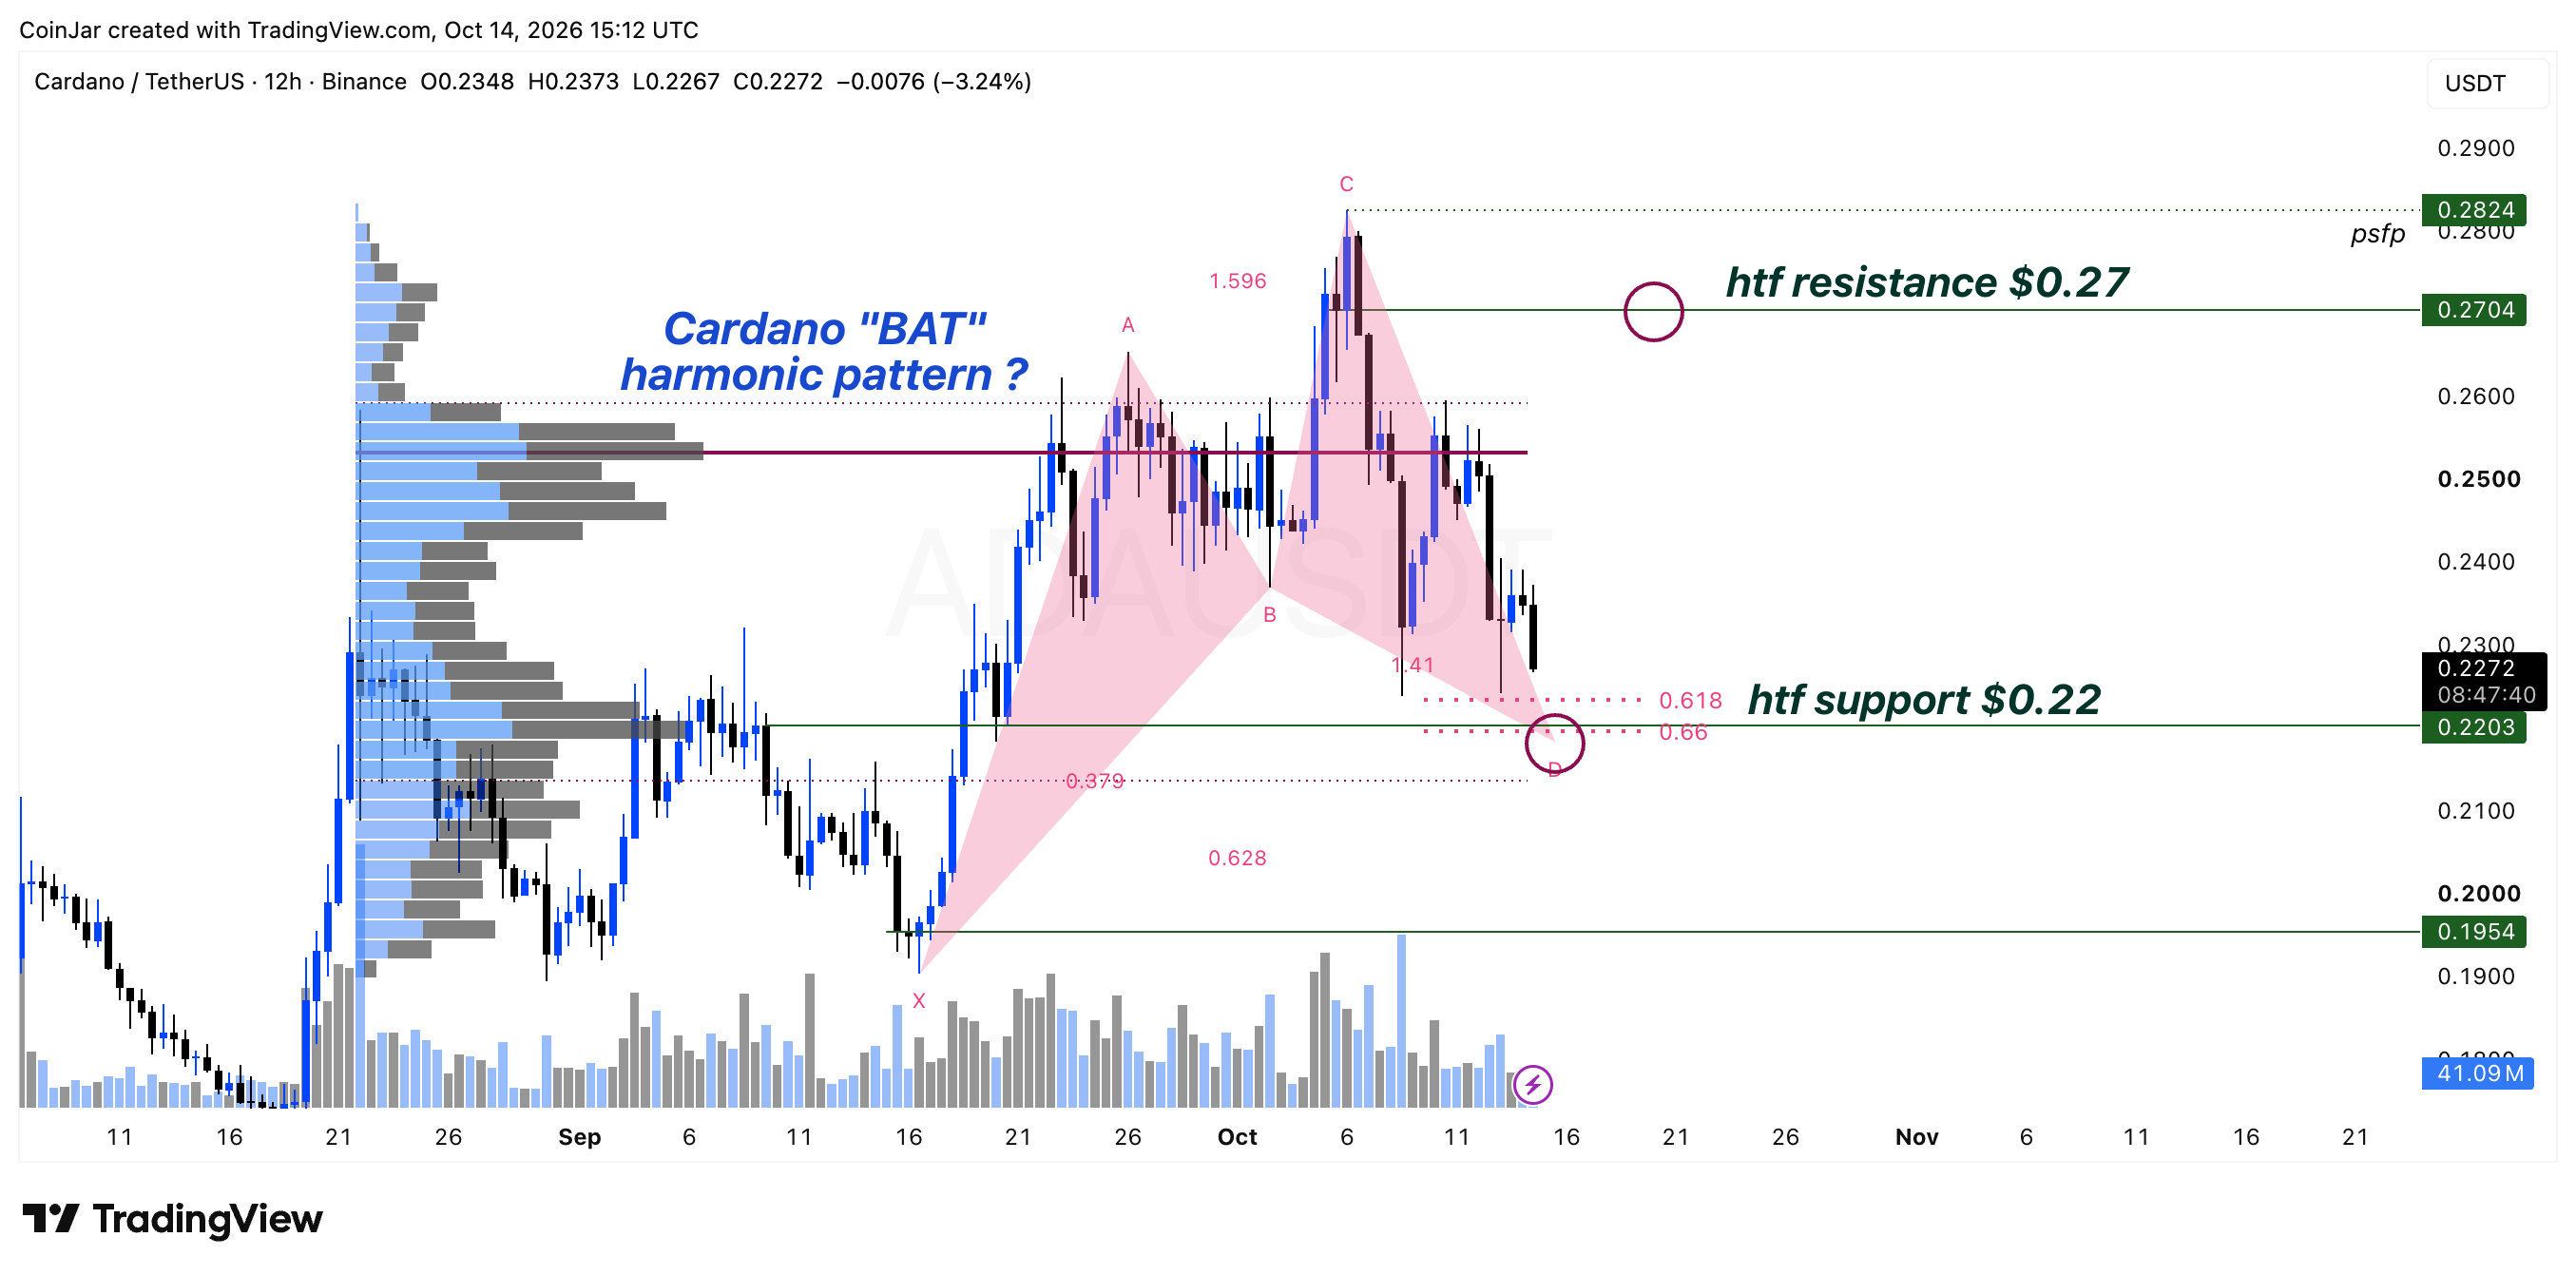
Cardano (ADA): Bullish Bat Harmonic Pattern Meets Support
Cardano (ADA) is currently developing a potential bullish Bat Harmonic pattern, a technical formation within the harmonic trading framework that uses Fibonacci retracement and extension levels to identify possible reversal zones and price objectives. While the pattern can help define a potential setup, confirmation from price action remains important before drawing conclusions about the next directional move.
The potential completion zone for this pattern aligns with the 0.618 Fibonacci level and higher-timeframe support around $0.22. This confluence creates an area of technical interest, where buyers may attempt to defend support and establish a reversal. However, the presence of a harmonic pattern alone does not guarantee a successful reaction, and the market will need to demonstrate sufficient buying pressure to support a recovery.
If ADA maintains price action above $0.22 and begins to show signs of renewed strength, the probability of a rotation towards resistance near $0.27 may increase. This level represents a potential upside objective rather than a confirmed target, with the reaction along the way likely to provide further insight into market strength.
Conversely, a decisive breakdown below $0.22 would weaken the bullish setup and potentially invalidate the Bat Harmonic pattern. Such a move could expose ADA to a deeper corrective phase as price searches for lower support.
Aziz for CoinJar
Want more chart analysis? Follow CoinJar on TradingView for regular technical analysis from our team:
https://www.tradingview.com/broker/CoinJar/publications-ideas/
The latest Fear & Greed index from CoinJar



Be the first to comment