



J.P. Morgan Asset Management has put a long-term return on Bitcoin for the first time, and at 10% a year it beats the 7.5% assumed for U.S. large caps.
Run the firm’s own inputs through a standard risk-adjusted measure, though, and Bitcoin pays almost exactly what stocks pay for each unit of risk. The firm also stopped short of modeling Bitcoin alongside its other asset classes, and the reason it gives is where the real argument lies.
10%
Bitcoin’s compound annual return assumption over 10–15 years
0.32
Sharpe ratio for both Bitcoin and U.S. large caps, by our calculation
0.33
Bitcoin’s historical correlation with U.S. large caps, the input JPMorgan doesn’t trust
What JPMorgan published, and what it held back
The figures appear in the 2027 Long-Term Capital Market Assumptions, released October 19. The annual report sets return, volatility and correlation estimates for more than 200 asset classes over a 10–15 year horizon. JPMorgan uses them to build its own strategic allocations. They are planning inputs, not calls on where prices go next.
Bitcoin gets a 10% compound annual return and 55% annualized volatility. U.S. large-cap stocks get 7.5%, up 0.8 percentage points from last year’s edition, with 18% volatility. Gold gets 5.5% with 17.2% volatility.
The more telling decision is where those numbers sit. JPMorgan has not yet added Bitcoin to its main covariance matrices, the tables that tell its models how assets move together and therefore how much of each to hold.
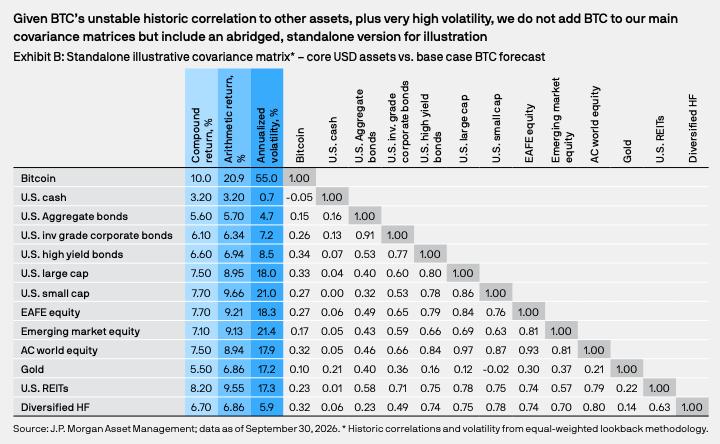
Bitcoin instead gets a separate, abridged matrix against 12 core U.S.-dollar assets, from cash and bonds to gold and hedge funds.
The report blames the volatility and unstable correlations of assets like Bitcoin. It also calls the idea that currency debasement will send investors rushing into crypto “wide of the mark.”
This return assumption is also separate from the Bitcoin price targets that JPMorgan’s investment-bank strategists have published in past years. It is the asset-management arm’s first entry for Bitcoin in the LTCMA.
Bitwise Chief Investment Officer Matt Hougan still treated the release as a milestone. In a post on X on October 20, he traced Bitcoin’s path from institutional dismissal to a line in JPMorgan’s return tables. He called it the projected “best-performing asset of the next decade.” His claim rests on the standalone Bitcoin exhibit, which sets Bitcoin against a short list of assets rather than all 200-plus. Among the figures JPMorgan highlights in its summary, the nearest to Bitcoin’s 10% are large-cap private equity at 9.6% and global value-added real estate at 9.3%. Hougan’s own long-run case makes room for deep sell-offs on the way up. That volatility is exactly what the risk-adjusted math charges for.
Why 10% turns into 20.9%
The Sharpe ratio is the standard measure of reward per unit of risk: expected return above cash, divided by volatility. JPMorgan calculates it with arithmetic returns rather than compound ones, and for a volatile asset the gap between the two is large.
Take an investment that gains 50% one year and loses 50% the next. Its arithmetic average return is zero, yet $100 ends at $75. The compound figure tracks what an investor actually keeps. The arithmetic figure is the simple average of yearly outcomes, and big swings push it higher. At 55% volatility, Bitcoin’s 10% compound assumption corresponds to a 20.9% arithmetic return. For U.S. stocks, at 18% volatility, the gap is far narrower: 7.5% becomes 8.95%.
Per unit of risk, a tie with stocks
| Asset | Compound return | Arithmetic return | Volatility | Sharpe ratio |
|---|---|---|---|---|
| Bitcoin | 10.0% | 20.9% | 55.0% | 0.32 |
| U.S. large-cap stocks | 7.5% | 8.95% | 18.0% | 0.32 |
| Gold | 5.5% | 6.86% | 17.2% | 0.21 |
Compound returns, arithmetic returns, volatility and the 3.2% U.S. cash return are from J.P. Morgan Asset Management’s standalone Bitcoin exhibit, as of September 30, 2026. Sharpe ratios are Coindoo calculations from those rounded inputs, using (arithmetic return − 3.2%) ÷ volatility. Bitcoin: (20.9 − 3.2) ÷ 55 = 0.322. Stocks: (8.95 − 3.2) ÷ 18 = 0.319. Gold: (6.86 − 3.2) ÷ 17.2 = 0.213.
Bitcoin’s return lead almost disappears. Its expected return above cash is about three times that of stocks, and so is its volatility, which leaves both at 0.32. Gold trails both at 0.21, so on JPMorgan’s inputs Bitcoin compares better with gold than with stocks.
Sharpe treats volatility as the whole of risk, and Bitcoin’s history shows the limits of that. It fell roughly 77% from its November 2021 peak to its November 2022 low, while the S&P 500’s worst decline in 2022 was about 25%. A ratio built on standard deviation doesn’t show how deep the losses go or how long recovery takes.
The case rests on correlation, the number JPMorgan won’t trust
Equal Sharpe ratios don’t make Bitcoin redundant. Two assets that pay the same for risk can still improve a portfolio together if they don’t move in step. JPMorgan’s exhibit puts Bitcoin’s historical correlation at 0.33 with U.S. large caps and 0.10 with gold.
Fed into a textbook optimizer, those inputs give an aggressive answer. Take a simplified two-asset mix of Bitcoin and U.S. large caps. By our calculation, the combination with the best Sharpe ratio holds about a quarter in Bitcoin and lifts the portfolio’s ratio from 0.32 to roughly 0.39. The entire gain comes from the 0.33 correlation. The higher the correlation, the smaller the gain, and at 1.0 it vanishes.
That is the input JPMorgan declines to rely on. Bitcoin’s correlation with stocks has been low on average, but it tends to jump when markets break. In March 2020 Bitcoin lost roughly half its value in two days as equities crashed. Through the 2022 rate-hiking cycle it sold off alongside technology stocks. A diversifier that falls with everything else in a crisis works in calm markets and fails when it is needed. By keeping Bitcoin out of its main matrices, JPMorgan stops an average correlation from driving allocations in its own models.
From assumption to allocation
Practitioners land far below the optimizer’s answer. BlackRock’s December 2024 paper on sizing Bitcoin put a reasonable range at 1-2% of a multi-asset portfolio. That range applies to investors who expect wider adoption and can absorb sudden plunges. BlackRock, which runs the iShares Bitcoin Trust, sized the position by how much it adds to total portfolio risk rather than by expected return. It capped it at 2%, citing the same unstable correlations.
BlackRock’s estimate: share of risk in a 60/40 portfolio
1% Bitcoin → about 2%
2% Bitcoin → about 5%
4% Bitcoin → about 14%
Average Magnificent 7 stock → about 4%
The arithmetic of a drawdown explains the caution. BlackRock notes that Bitcoin has gone through 70–80% peak-to-trough sell-offs. A 1% position that loses 75% costs the portfolio 0.75%; a 5% position costs 3.75%. At one size the same crash is a footnote, and at another it defines the year. That trade-off sits at the center of position sizing through Bitcoin drawdowns.
JPMorgan’s numbers give investors a way to test Bitcoin, not a weight to hold. The return column puts Bitcoin first. The risk-adjusted column puts it level with stocks. The correlation that would justify owning both is the input JPMorgan says it can’t yet rely on. The signal to watch is whether next year’s edition moves Bitcoin into the main matrices. Until then, choosing a portfolio weight takes more than picking the highest number in the return column.
This article is provided for informational purposes only and does not constitute financial or investment advice. Model assumptions and illustrative calculations do not guarantee future performance.

Kosta has reported on cryptocurrency markets and blockchain infrastructure since 2020, bringing over six years of hands-on experience in the crypto industry built through daily tracking of markets, trends, and emerging blockchain developments. Specializing in Bitcoin on-chain analysis, institutional ETF flows, and digital asset price action, his work at Coindoo has been cited by other news agencies and consistently covers market developments with a focus on data-driven reporting across Bitcoin, Ethereum, Solana, and XRP.
Over the years, Kosta has contributed to multiple crypto media outlets in different regions, authoring over 6,000 articles across the sector. His reporting spans cryptocurrency markets and the broader fintech industry, tracking not only price action but also the technological and regulatory forces shaping the ecosystem.
To support his analysis, Kosta actively leverages on-chain data and metrics from leading platforms such as Santiment, Glassnode, and CryptoQuant, enabling deeper, evidence-based market insights. He believes in the power of transparency and the data that underpins the blockchain ecosystem.
His academic background in Marketing Management from Denmark further complements his analytical approach, adding a strong understanding of communication strategy and content positioning to his work.


Be the first to comment