



Traders are looking to test the lows as the momentum slows and major support levels present themselves, and then whether the selling pressure will persist or turn to a rally before the end of December.
The swift drop in silver prices in October has put the precious metal at a pivotal level, and the metal has dropped by almost 6% over the last week.
Silver Extends Its October Decline as Selling Pressure Builds
The supplied Trading Economics chart shows silver prices dropping 5.96% for the week to $53.883 per ounce.The weekly chang show-3.412. The prices were again hovering around $53.9 on October 24, and the chart was indicating a big pullback from above $57 earlier this week.

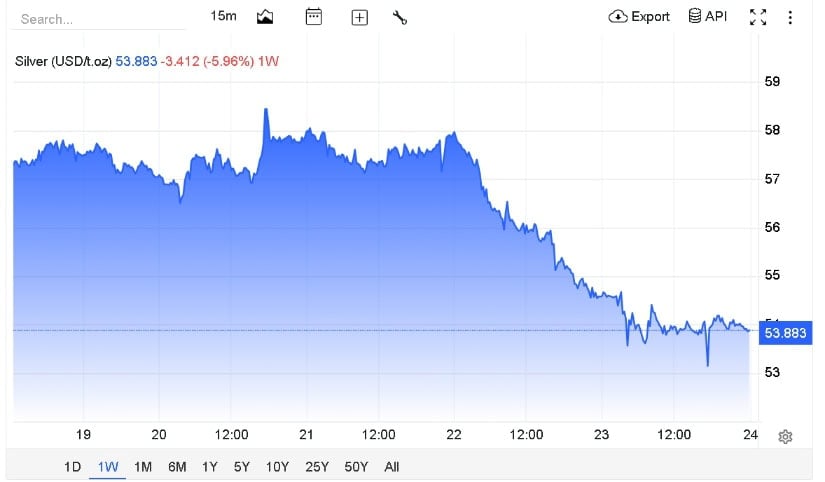 The drop further escalated since October 22, when silver breached the $56 level and headed down to $54. Source: TradingEconomics
The price closed in the mid-$50s, before stabilising a fraction of a penny higher. The chart displays a brief period of consolidation late in the week; however, this is not yet a confirmation of a longer-term reversal.
Further market commentary also highlights yield pressures, a stronger US dollar and interest-rate expectations. On October 23, FOREX.com news agency said that silver had found a long-term support base of 50-55 after a wide precious-metals sell-off.
TradingView Signals Point to a Weak Technical Structure
As of October 24, silver was trading at $53.918 on the provided TradingView chart, which had declined by 1.26% during the session. The displayed moving averages were at $61.309 and $63.618, respectively, which were still above the price. Both were on a downward trend, suggesting that prices in recent times have been subdued during the considered time periods.
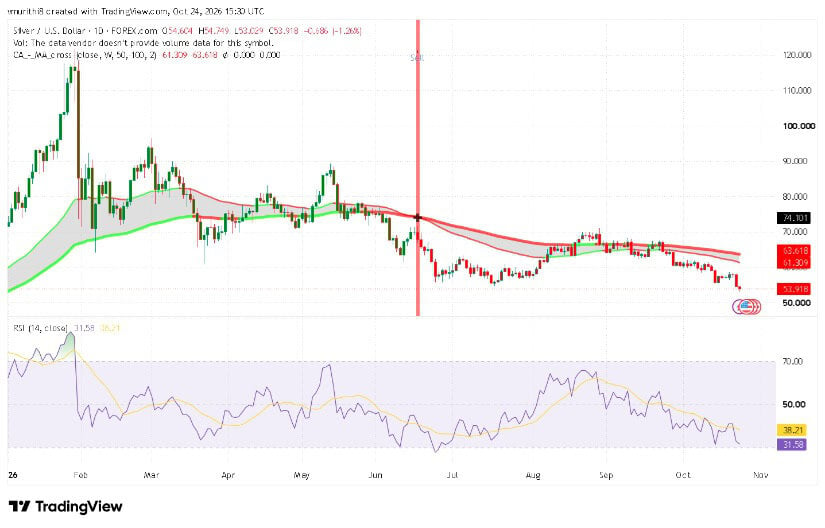 The Relative Strength Index (RSI) was at 31.58, which is below the average level of 38.21. The latest reading puts silver near the 30 level, which is typically seen as oversold. Source: TradingView
But this isn’t a conclusive sign of recovery, especially if the prices continue in the form of lower lows. The first important area of the technical zone is the interval between $53 and $55. Any continuation of the trend below $53 would leave the market open for more losses to the $50 price level.
On the other hand, a recovery above $55 will signal an initial stabilisation. However, with more evidence of a change in trend, silver would need to reach higher levels and test resistance at $61-$64.
These levels are technical levels that you are given in this chart and NOT guaranteed future trading levels. A change in the price action may be in sight, depending on the direction of US Treasury yields, the dollar and the general sentiment on precious metals.
October and December Forecasts rely on a Market Reversal.
October and December Forecasts Depend on a Market Reversal
However, the charts are looking for caution for the rest of the month as silver is still trading below its period averages. A break above $55 would signal a short-term recovery, while a drop below $53 would increase downside risk. The 50-55 zone continues to be significant as market analysts have found it to be a wider support area.
December is a more ambiguous month. In the August forecast, J.P. Morgan had an average of $63/oz. for Q4 and $70.60/oz. for 2026. The forecast aligned with expectations of easing physical-market tightness, declining industrial demand, and interest-rate pressures. These are average which are forecasts and do not guarantee December closing prices.
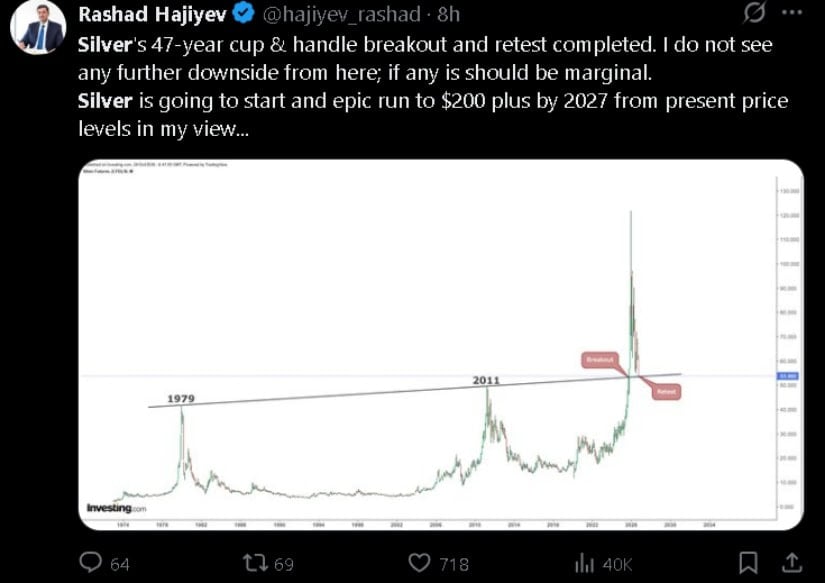 On X, Rashad Hajiyev stated that silver has formed a long-term cup and handle breakout and retest. Prices may even reach $200 by 2027, he said. Source: X Via Rashad
This, of course, is an analyst’s bull case and not a market consensus or actual projection. Buyers would have needed to take control and break out of the technical resistance near $60–$63 to make a move in December.
A continued lacklustre performance may instead drag silver down to around $50–$55. The evidence provided herein suggests that the next few months are a period of caution until prices recover and cross key moving averages, but the longer-term trend depends on monetary policy, industrial demand and investment flows.



Be the first to comment