


What to know:
- Bitcoin faces growing selling pressure, hovering near a critical support level amid weakening market momentum.
- Bloomberg strategist Mike McGlone warns of a potential drop to historically significant $10,000 levels.
- Technical indicators show bearish signals: RSI is oversold, MACD is negative, and price is below key moving averages.

Bitcoin is facing more selling pressure on April 2, 2026, as the price’s momentum is declining and approaching a crucial support area. Bloomberg Intelligence’s strategist has issued a warning that the Bitcoin price might fall to much lower levels in the future as the crypto market has started to show signs of cooling. Despite all the negative signs, the Bitcoin price is holding a crucial support area.
Bitcoin Weakens Amid Bearish Warnings
Adding to the cautious outlook, Mike McGlone, Senior Commodity Strategist at Bloomberg Intelligence, presented his bearish outlook for X (formerly Twitter) on April 2, 2026.
McGlone has stated his view that the crypto market might be undergoing a correction phase after the significant growth witnessed in the past few years. This might cause Bitcoin’s price to fall to the $10,000 mark in 2026.

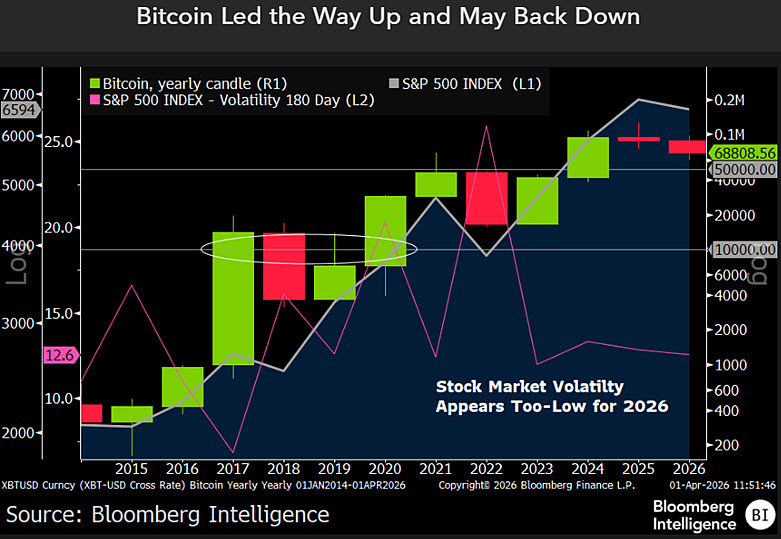
Source: Mike McGlone’s X Post
McGlone indicated that prior to the significant liquidity increase seen in 2020 and 2021, Bitcoin traded at these levels. Further, McGlone stated that $10,000 has traditionally been one of Bitcoin’s most active price points since 2017, when futures were first introduced.
McGlone added that while there are thousands of different cryptocurrencies, only a small percentage are closely related to “real-world value,” though this is all speculative.
Also Read | Metaplanet Acquires 5,075 BTC, Expands Bitcoin Holdings to 40,177
Bitcoin Slows Down Near Key Support
From a technical point of view, Bitcoin is showing signs of weakness as it trades close to an important support area. The Relative Strength Index (RSI) is currently at 31.94, remaining below its signal line at 33.60, indicating weakening buying strength and oversold levels.
Bitcoin is still below major moving average levels. These include the 20-day SMA priced at $79,143 and the 50-day SMA priced at $87,471. This shows bearish pressure is still intact.
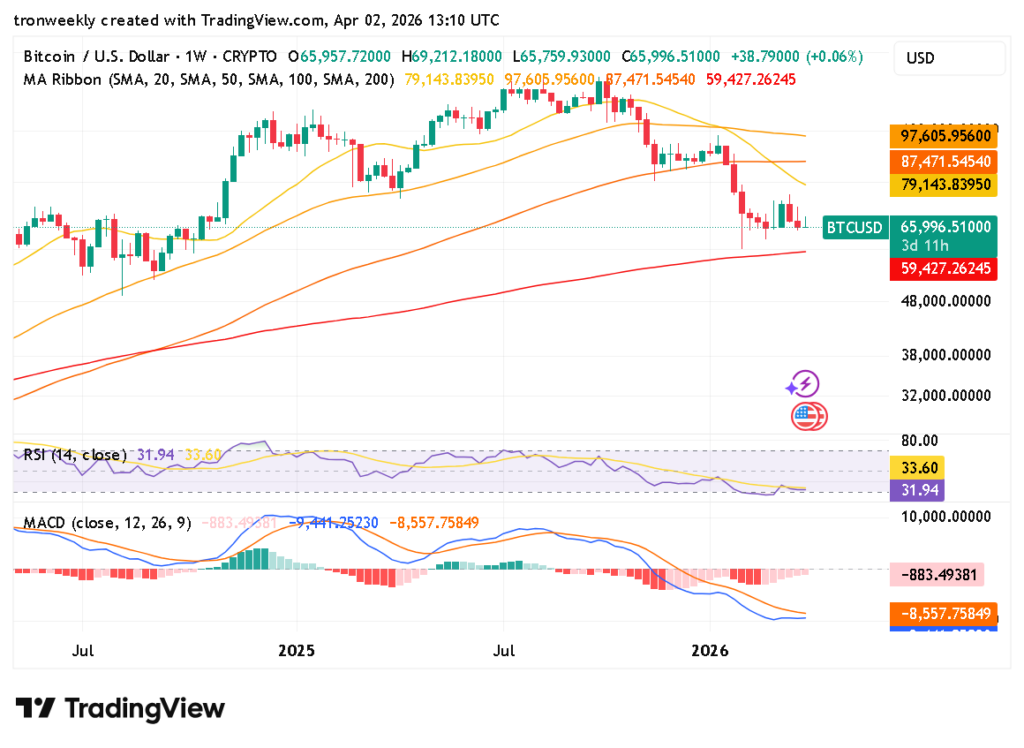
Source: TradingView
The price remains above the 200-day SMA, which is currently trading at $59,427. This might act as a support in case the selling continues. However, the MACD remains in the negative zone, with the MACD line trading at -9,741 and the signal line trading at -8,557.
At the time of writing, Bitcoin is trading at $65,806, with a 24-hour trading volume of $50.87 billion and a market capitalization of $1.32 trillion, according to CoinMarketCap data. The BTC declined by 3.34% over the last 24 hours.
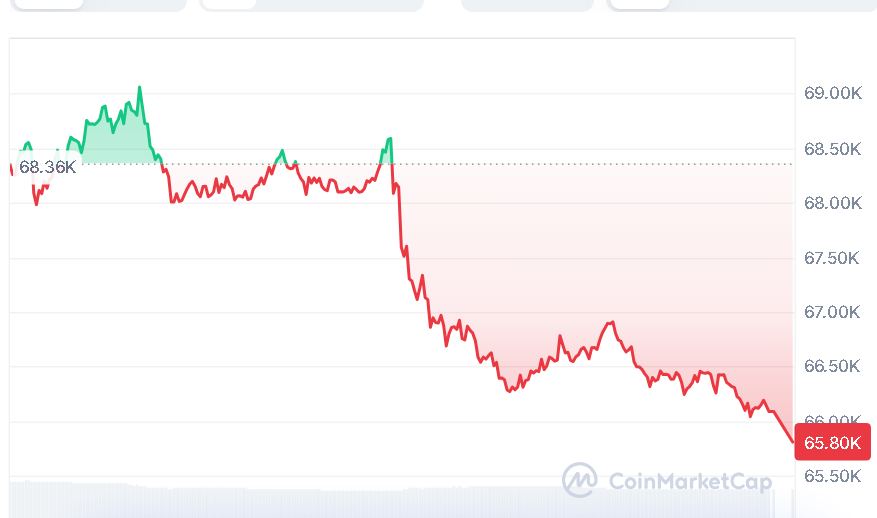
Source: CoinMarketCap
Bitcoin Shows Early Stabilization Signs
Overall, Bitcoin’s price action suggests a market in trouble, but stabilization signs might be seen if the levels hold in the coming days. This information is for educational and informative purposes only and should not be considered financial advice.
This article contains market analysis and price predictions. These are not guarantees. Crypto markets are volatile. Always DYOR. Not financial advice.
Also Read | Gold Price Crashes Below $4,600 Amid Trump-Driven Geopolitical Tensions

Be the first to comment