


What to know:
- HYPE trades near $42 resistance as volume jumps 22%, signaling rising market interest.
- A break above $42.30 may trigger a rally, while rejection keeps the price in a range-bound phase.
- RSI at 65.52 and MACD positive signal strengthening the bullish momentum trend.

As of April 11, the Hyperliquid (HYPE) token is trading near a key resistance level as market activity increases. The price has shown steady gains over recent sessions. Traders are closely watching for a breakout or rejection at current levels.
According to CoinMarketCap data, HYPE is trading at $41.55, showing a 3.24% rise in the past 24 hours. Trading volume increased by 22.27% to $341.47 million. The token also recorded a 14.04% gain over the last one month, reflecting sustained demand.
Also Read: Hyperliquid (HYPE) Gains Strength as Bulls Eyes $43 Breakout Point

HYPE Holds Range After Sharp Reversal
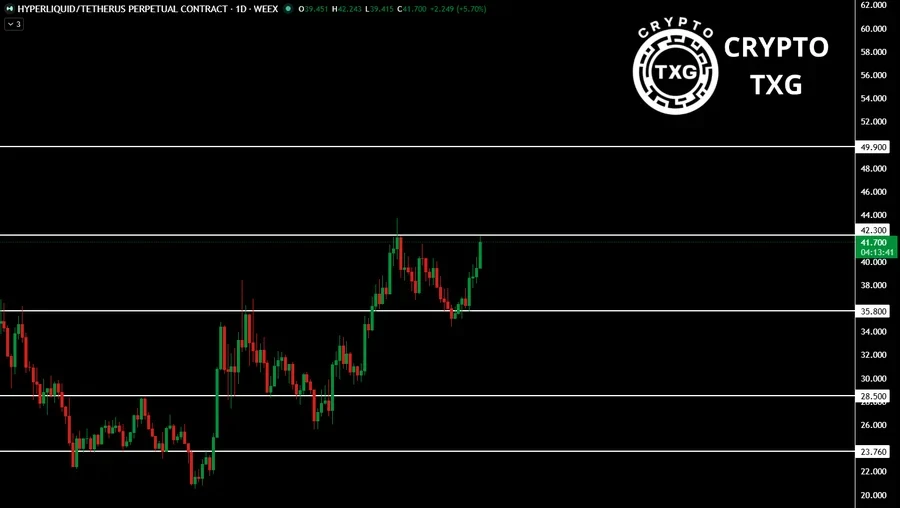
Analyst Crypto TXG highlighted that HYPE recently dropped below the $35.80 support level. The move did not hold and quickly reversed. The price then moved higher and returned to its previous range. It is now testing resistance near $42.30.
Moreover, a breakout above $42.30 might see the price rising further. However, should the level hold, the coin might continue consolidating sideways within the present range. The price reaction from this level will determine its future direction.

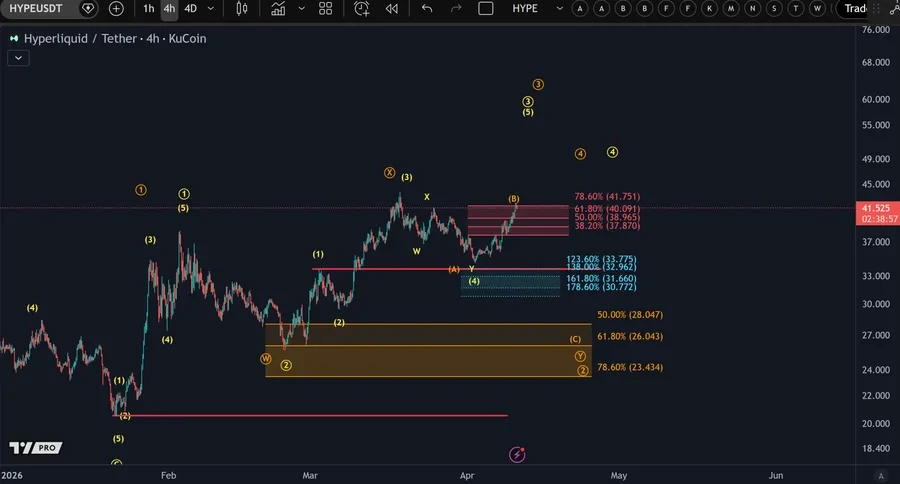
Additionally, another analyst, MCO Global, revealed that HYPE is challenging resistance at $42.75. The pattern still looks rangebound. There has been no defined trend at this time because of the present pattern.
According to the analyst, rejection below the resistance level would see a price fall in play. Support will be found around $34 according to the existing pattern. Meanwhile, a breakout above the resistance level will see the price rally upwards.

According to CoinLore data, $39.87 acts as a short-term support area. The current level has managed to resist the latest price action. Another support level can be found below at $35.03.
Resistance can be seen at $43.82. Any break above this level will likely push prices to wider ranges. Another resistance level is at $49.45 and $57.30.
RSI and MACD Support Uptrend
According to TradingView data, the Relative Strength Index (RSI) shows an upward momentum. The current RSI reading is 65.52, whereas the signal line reading is 52.50. This represents an increase in buyers’ strength but not enough to be categorized as overbought.
The Moving Average Convergence Divergence (MACD) depicts a positive shift. The MACD line is recorded at 0.816, above the signal line, which is recorded at 0.632. The histogram reading is 0.184, showing strengthening upward momentum.
This article contains market analysis and price predictions. These are not guarantees. Crypto markets are volatile. Always DYOR. Not financial advice.
Also Read: Bitcoin (BTC) Breaks Bullish Pattern After CPI Relief: Is $80,000 Next?
Be the first to comment