



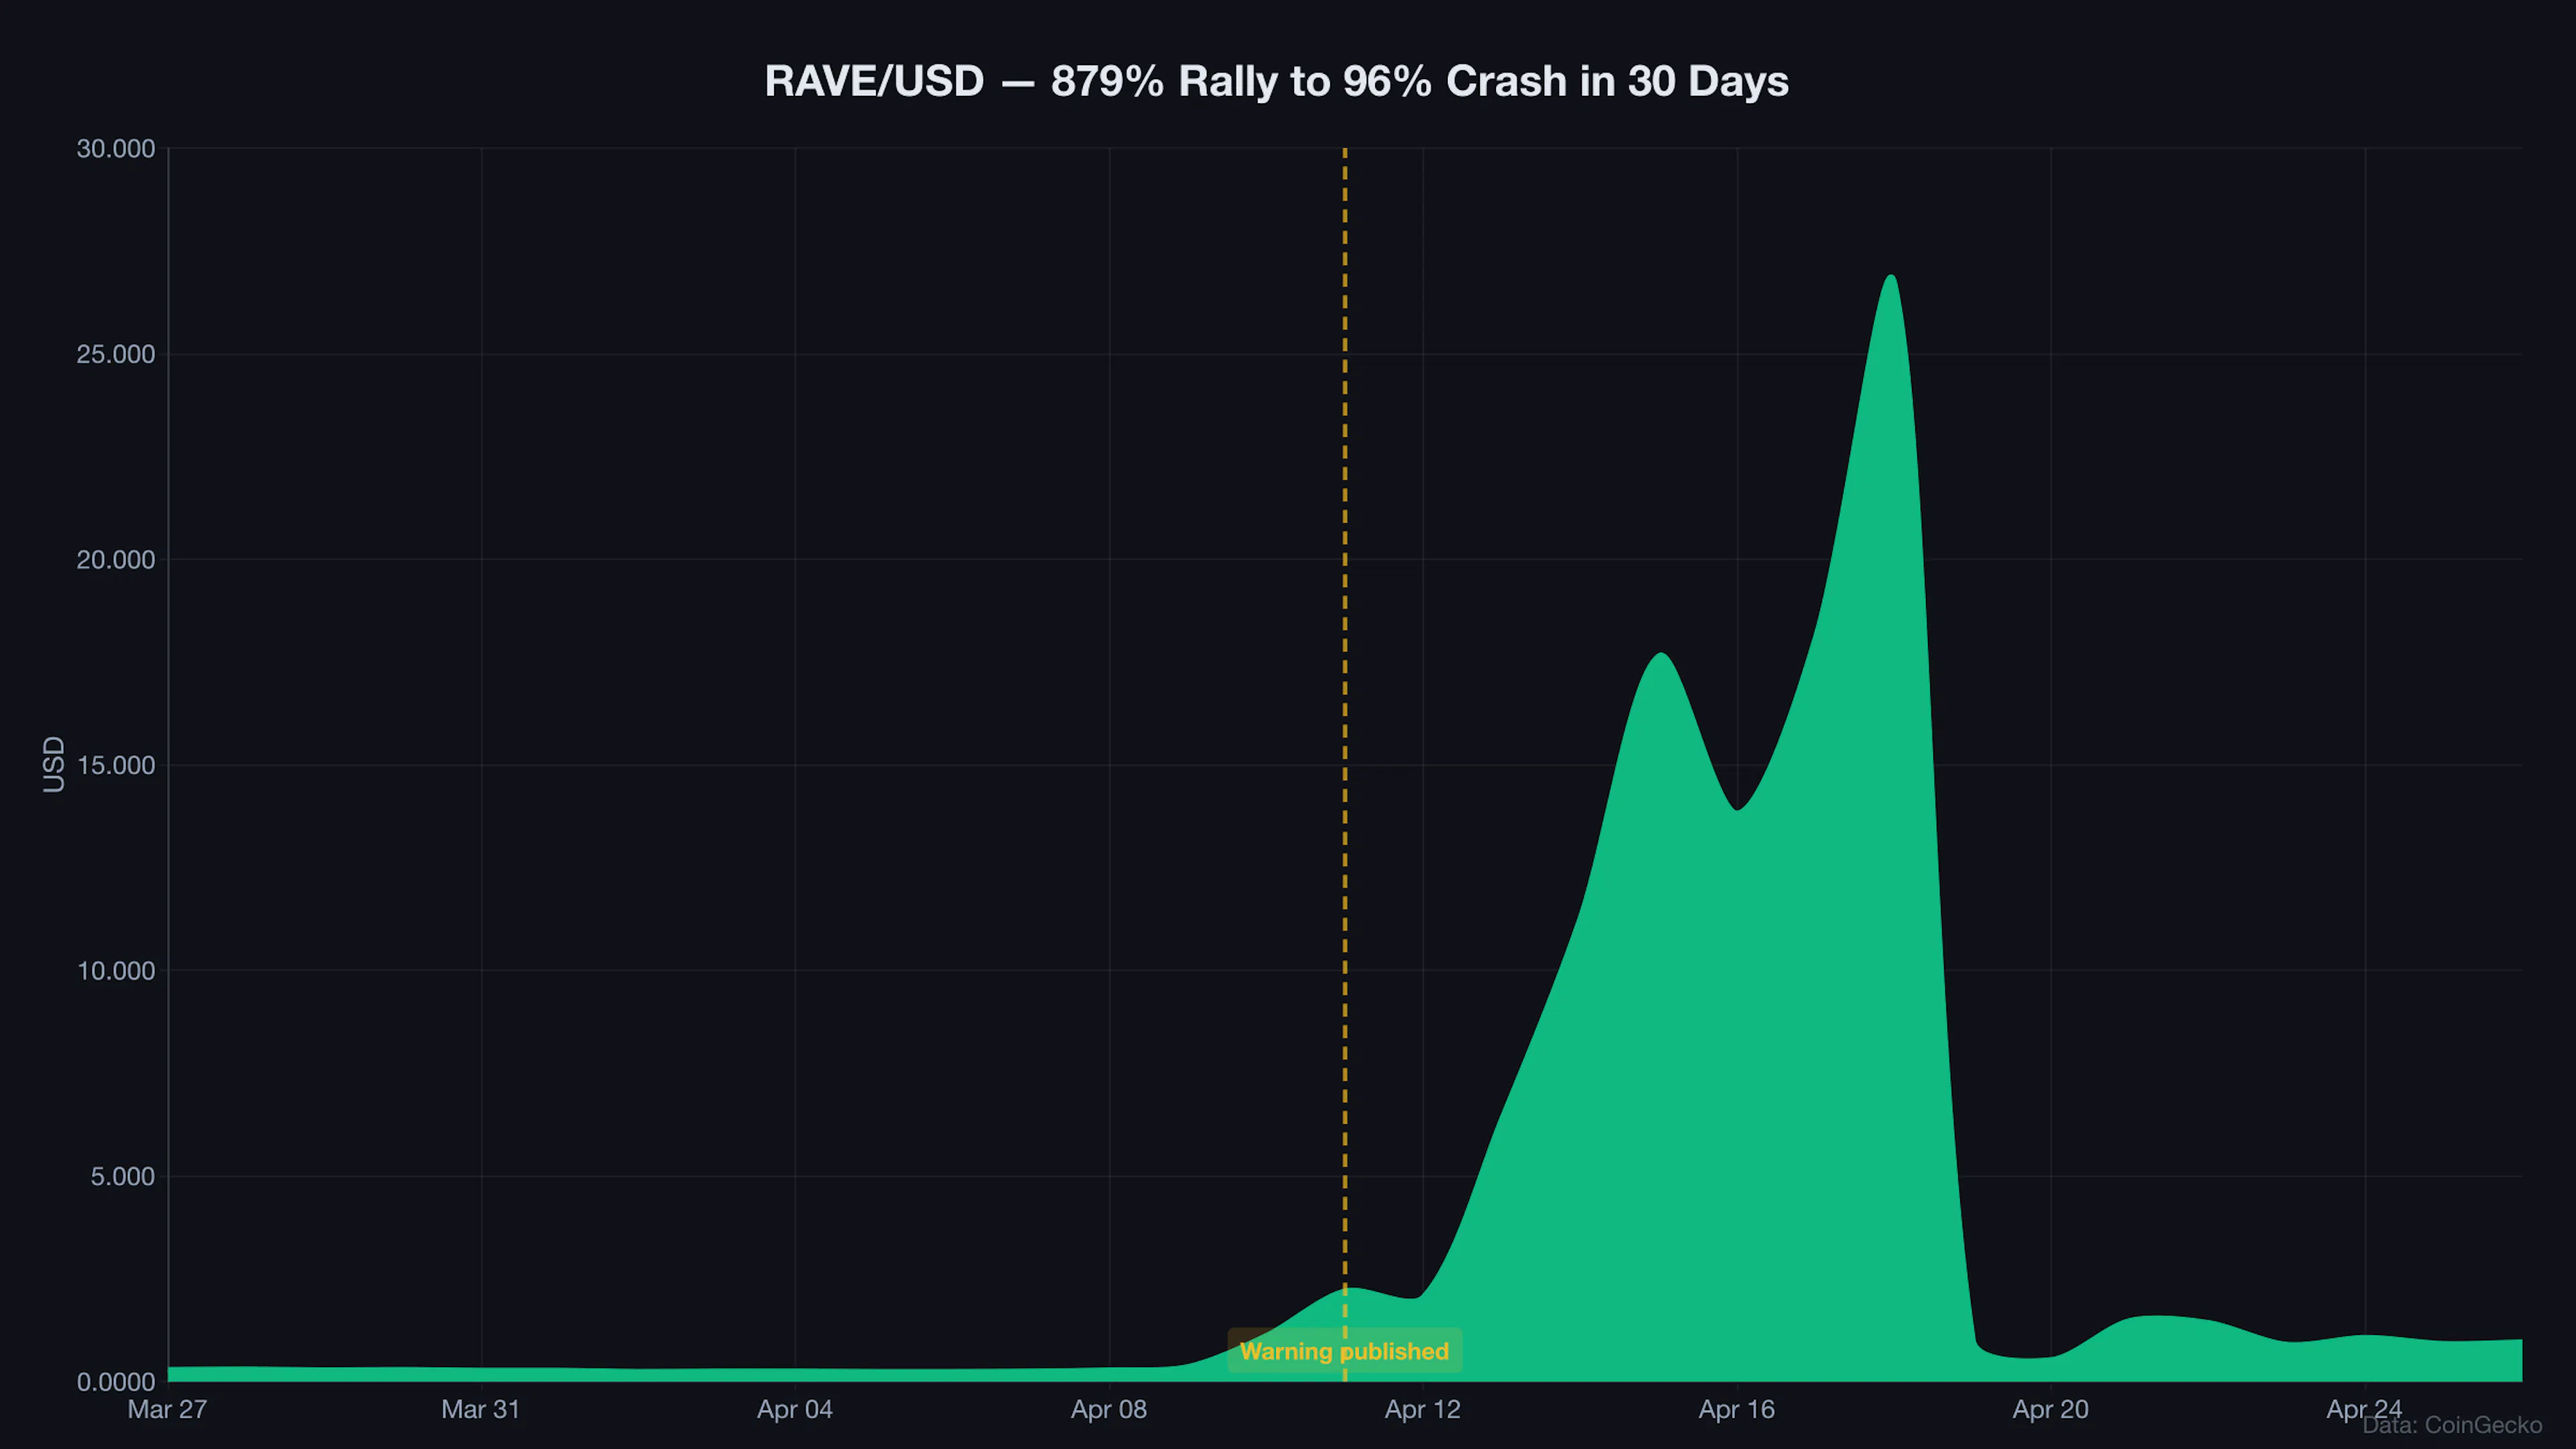
On April 11, I published an analysis of RaveDAO (RAVE) flagging five structural risk factors. Eight days later, the token lost 96% of its value.
I had seen the setup before. The $TRUMP memecoin had crashed from $73.43 to $2.83 months earlier. The collapse left 764,000 wallets holding combined losses of $2 billion. RAVE matched the template — same 24% circulating supply, same 4x gap between market cap and fully diluted valuation — so I wrote the warning before the token had even peaked.
RAVE’s crash proved the framework. I then watched the same five signals fire across three more token launches over that same month.
Five Signals, One Pattern
I track new token launches for a living. After studying how tokens with thin floats and inflated valuations implode across dozens of projects, I distilled the predatory structure down to five signals. A token that triggers three or more has — in every case I have tracked — lost 50% or more within 30 days of its peak.

Float below 25%. I check circulating supply versus total supply on CoinGecko. When less than a quarter of tokens are trading, insiders hold the rest behind vesting schedules or locked wallets. Every token in this analysis sat between 20% and 25%.
Fully diluted valuation gap above 3.5x. RaveDAO’s FDV reached $902 million against a market cap of $224 million — meaning 75% of the token’s value had not entered the market. Zach Rynes, community ambassador at Chainlink, called structures like these “predatory tokenomics” in a public post. Binance Research put a number on the broader problem, estimating in a 2024 report that $155 billion in locked tokens across hundreds of projects will enter circulation before 2030 — supply that current holders will have to absorb.
Trading volume above 3x market cap on day one. Healthy spot trading for a $150 million token generates $50 million to $100 million in daily volume. When I see $700 million against a $157 million market cap, the money is speculative and will leave fast.
Governance concentration. I check who controls the multisig, how many validators run the chain, and whether one entity holds majority stake. The information is public if you know where to look: governance forums, L2BEAT infrastructure ratings, on-chain explorers.
Zero development activity. I pull GitHub data over a four-week window and look for commits, stars, forks, open pull requests. For layer-2 tokens, I check L2BEAT’s staging assessment. Zero commits plus a Stage 0 rating means the chain exists to distribute tokens, not to ship code.
RAVE Crashed Seven Days After I Flagged It
When I pulled RAVE’s data on April 11, the token had already rallied 879% in three weeks. CoinGecko showed 248 million tokens in circulation out of 1 billion total. The float was 24.8%.
RAVE’s fully diluted valuation sat at $2.14 billion against a $511 million market cap — a 4.2x gap. Lookonchain, the on-chain analytics firm, had flagged 18.58 million RAVE worth $8 million moving from wallets controlled by the project to Bitget, a pattern that typically precedes staged sells on the open market. I published the analysis and drew a direct comparison to $TRUMP.
 Comparison table showing RAVE KAT CHIP HYPE with float percentage FDV gap volume ratio governance risk and crash outcomes
Seven days later, RAVE peaked at $27.88. The token fell to $1.13 in 18 hours. ZachXBT, the pseudonymous blockchain investigator, later exposed three Gnosis Safe wallets that had controlled 90% of the supply throughout the entire rally.
RAVE now trades at $0.90, down 96.8% from its peak. The float remains 24.8%.
Katana Claimed No VCs — Polygon Labs Was on the Multisig
Katana (KAT) launched with “no VC” branding. No institutional insiders. No preferred exit terms.
When I checked the governance data, Polygon Labs and GSR Capital were sitting on the multisig. Polygon Labs had incubated the chain itself. GSR — a trading firm that provides liquidity to exchanges — co-developed the protocol. The label “no VC” was technically correct, since neither firm operates as a venture capital fund, but the economic arrangement was identical to a traditional backed launch.
KAT floated 2.34 billion tokens out of 10 billion total — a 23.4% float with a 4.27x FDV gap. I checked GitHub over four weeks and found nothing: zero commits, zero stars, zero forks. L2BEAT classifies Katana as Stage 0, meaning the sequencer can censor transactions and users have no forced exit mechanism.
As of April 26, KAT has fallen 56% from its all-time high — set just two days earlier on April 24. The token dropped another 44% in the 24 hours before I finished this piece. Next unlock arrives May 18: 176.8 million KAT entering circulation.
CHIP’s First Trading Day Lit Up Every Metric
USD.AI’s CHIP token generated $700 million in volume on launch day against a $157 million market cap — a 4.5x ratio and the highest reading I had recorded on any first day since building the framework.
I checked the float: two billion tokens circulating out of 10 billion total, a 20% float and the lowest in this analysis. The FDV gap was 5x, the widest.
Within hours of listing, blockchain analysts tracking CHIP’s flows on CoinGecko flagged the top wallet. The wallet held 1.79 billion CHIP — 17.5% of total supply — and was moving tokens from a Gnosis Safe toward Gate.io and Robinhood hot wallets. The staging pattern matched RAVE’s deposits on Bitget before the crash.
CHIP peaked at $0.138 on April 23. Three days later, the token trades at $0.068. Down 50.2%.
Hyperliquid Triggers Four Flags but Earns $844 Million
Hyperliquid (HYPE) floats 23.8% of its supply. The fully diluted valuation of $39.6 billion towers over a $9.8 billion market cap, creating a 4.04x gap. Five Foundation validators control 81.4% of staked HYPE — past the 67% consensus threshold required to halt the chain.
Gracy Chen, CEO of Bitget, warned in March 2025 that Hyperliquid risked becoming “FTX 2.0,” a comparison that gained weight after the JELLY incident when the protocol’s team settled a position at a 98% discount to the oracle price and triggered $211 million in USDC outflows from the platform. Grayscale Investments has filed an S-1 for a spot HYPE exchange-traded fund while these governance concerns remain open.
HYPE differs from the other three in one measurable way. The protocol earned $844 million in 2025 and returned $645 million to holders through buybacks. Hyperliquid commands 73% of the perpetual DEX market across 609,000 users — a real business underneath the token structure. Revenue offsets dilution pressure from future unlocks in a way that RAVE, KAT, and CHIP cannot replicate.
HYPE has fallen 30.6% from its all-time high. A correction, not a collapse.
Five Minutes on CoinGecko Can Flag the Next One
You can run this check before buying any token that launched in the past 90 days:
- CoinGecko — check circulating supply versus total supply. Float below 25% is the first flag.
- CoinGecko — divide FDV by market cap. Above 3.5x is a warning.
- CoinGecko or CoinGlass — compare 24-hour volume to market cap. Above 3x on a new token signals speculative excess.
- L2BEAT — for layer-2 tokens, check the stage rating. Stage 0 means the team controls the chain.
- GitHub — search the project name. Zero commits in four weeks means the product is the token.
The framework is not perfect. Hyperliquid proves that a token can trip four flags and hold value when the protocol earns real revenue. But every token in my dataset that triggered four or more flags without revenue has lost at least 50% within 30 days. RAVE and KAT — which triggered all five — lost 57% to 97%.
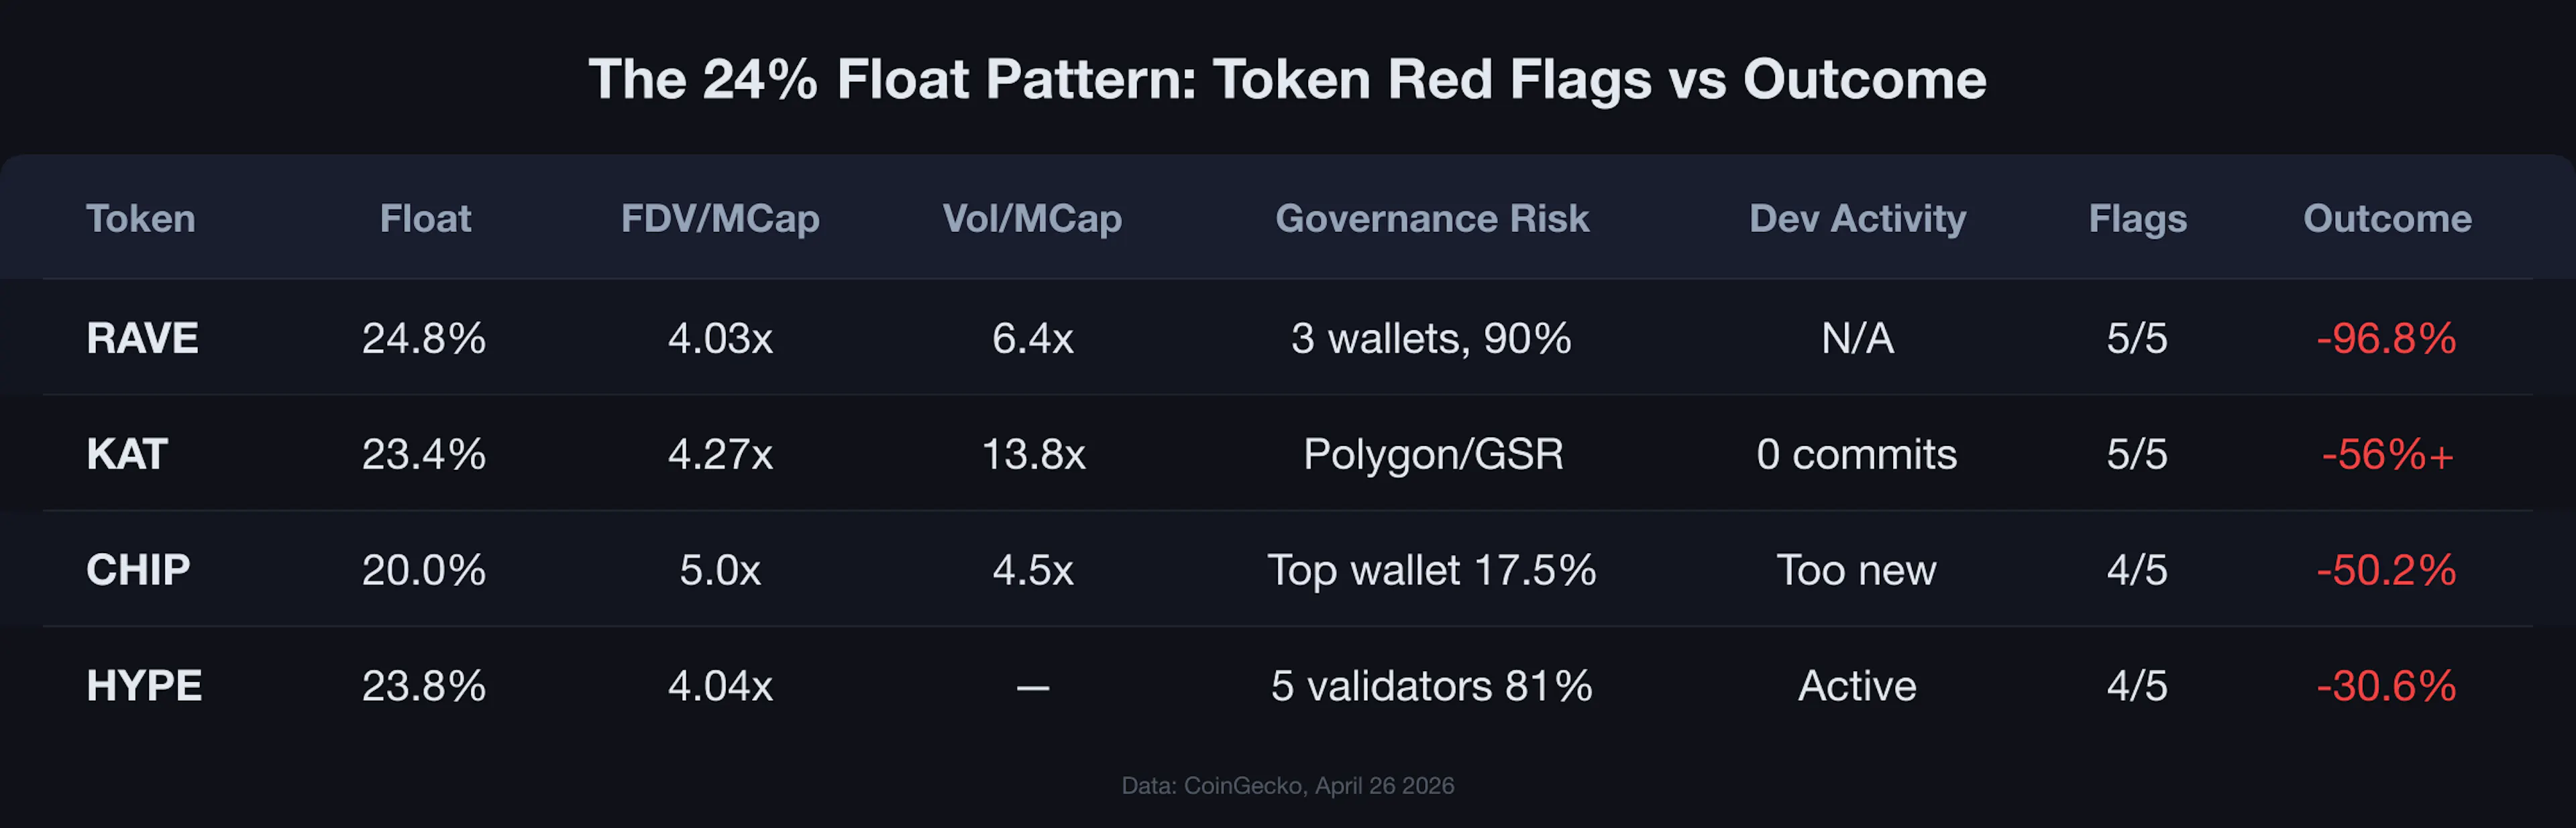 Comparison table showing RAVE KAT CHIP HYPE with float percentage FDV gap volume ratio governance risk and crash outcomes
The fair launch narrative promised to cut out insider advantages. The 2026 token market built a refined version of the same game: lock 75% to 80% of supply, pump the price on a thin float, and give insiders a calculated exit ramp dressed as community distribution.
If you see a 24% float next to a 4x FDV gap, run the other three checks. Three flags or more means you are not buying an investment. You are the exit liquidity, and the timer is already running.


Be the first to comment