


What to know:
- Binance Coin shows stabilization near $608, but weak momentum keeps the price below key resistance.
- RSI at 46.26 signals mild buying pressure, while the price stays under MA levels.
- A confirmed breakout above resistance is required to shift the overall bearish market structure.

Binance Coin (BNB) has been showing signs of stabilization after a period of decline, although the strength of the rally may be questionable due to the cryptocurrency trading below its resistance level.
At the time of writing, BNB is trading at $608.58, with a 24-hour trading volume of $1.19 billion and a market capitalization of $82.94 billion, according to data from CoinMarketCap. BNB posted a modest 0.23% gain over the last 24 hours, reflecting early attempts to stabilize after recent selling pressure, though overall momentum remains limited.

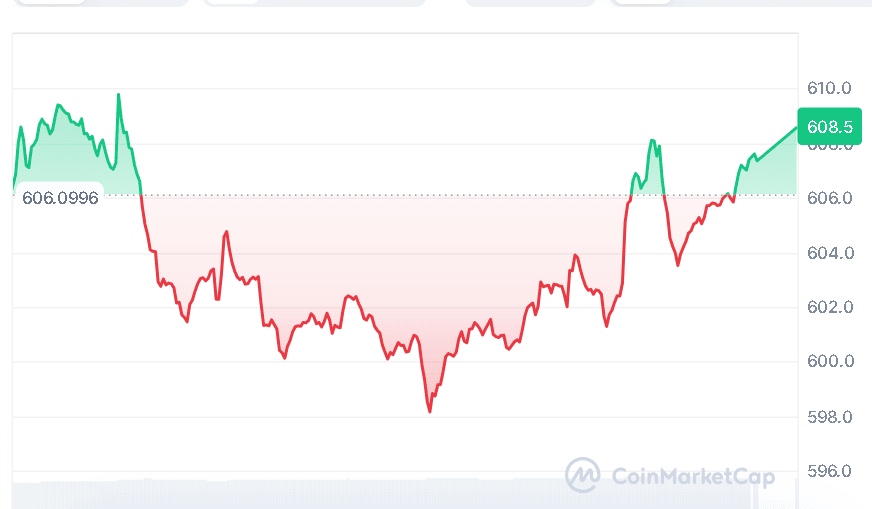
Source: CoinMarketCap

Also Read | Shiba Inu Holds Key Support as 57B SHIB Outflows Boost Bullish Structure
Binance Coin Faces Key Breakout Test
A well-known crypto analyst, BitGuru, commented that BNB’s current price pattern indicates a temporary bounce but not a bullish reversal.


Source: BitGuru’s X Post
It should be noted that breaking out from above those levels of resistance is crucial for confirming any future bullish pattern, as not doing so could mean that the asset remains trapped in a consolidation pattern.
Technical Indicators Show Gradual Improvement
In terms of technical analysis, there is evidence of a weak rebound. At present, the RSI is standing at 46.26, which is higher than its usual level, implying that there is weak buying pressure. Nevertheless, BNB is still trading below the MA ribbon, and its 20-day simple MA is at $612, while its 50-day MA is at $626.

Source: TradingView
Longer-term moving averages continue to hold a much higher level, emphasizing the existing bearish structure. Therefore, even though the current sentiment shows signs of stabilization, the overall tendency continues to support the bears.
The Moving Average Convergence Divergence (MACD) indicator, on the other hand, is showing initial indications of a possible momentum change. The MACD line is nearing the signal line, while the histogram has become positive, suggesting that selling pressure is starting to subside.
Why This Matters?
A breakdown above resistance is needed for BNB to escape consolidation and allow short-term investors to take advantage of any potential upward movements.
BNB is one of the primary tokens in the Binance environment, making its price action an indication of the sentiments prevailing in the altcoin space. Although technical metrics indicate that bearish pressure might be losing steam, a breakout is still necessary before the picture becomes positive.
This article contains market analysis and price predictions. These are not guarantees. Crypto markets are volatile. Always DYOR. Not financial advice.
Also Read | Avalanche Tests $10.5 Resistance as Analysts Eye Drop to $5 or Rally to $24

Be the first to comment