


What to know:
- SEI has formed an inverse head and shoulders pattern that suggests a bullish breakout if key support levels hold.
- The price is facing resistance near $0.059, while support around $0.053 remains critical for short-term direction.
- Bollinger Bands are tightening, and MACD remains neutral, indicating low volatility and market indecision.

Sei (SEI) is moving in a downward direction following the presence of bearish pressure in the crypto market. According to CoinMarketCap, the SEI price has declined by 5% over the last 24 hours but remains stable over the last week.
At the time of writing, SEI is trading at $0.05615, with a trading volume of $38.77 million, which has declined by 8.14% over the last 24 hours. However, its market capitalization stands at $391.6 billion, which is down by 5.03%.

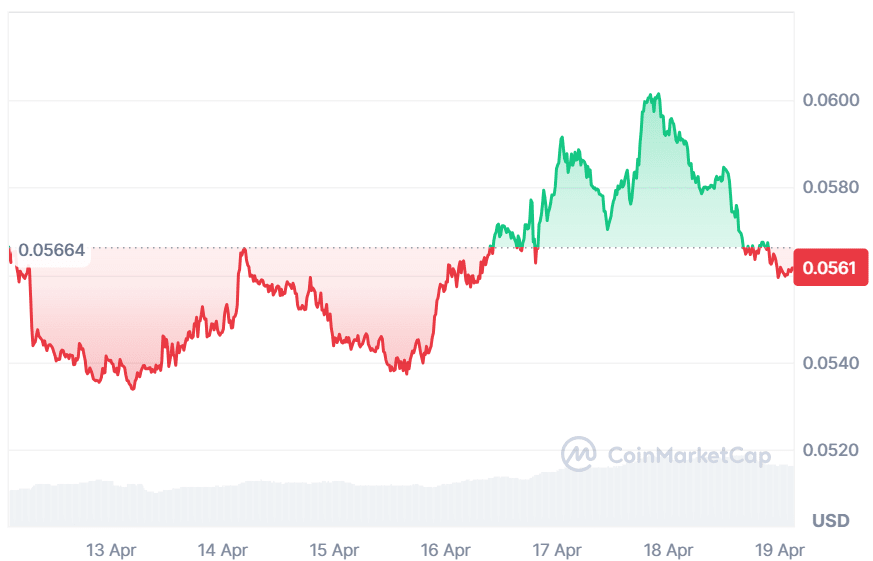
Source: CoinMarketCap

Also Read: Sei (SEI) Falling Wedge Breakout Could Trigger a Strong Rally Toward $0.12
SEI Bullish Pattern Targets $0.50 Breakout
Furthermore, the crypto analyst Whale_Crypto_Trading highlighted that SEI is gaining attention as it retests the broken neckline of an inverse head and shoulders pattern on the daily chart.
This structure is often seen as a bullish reversal signal, suggesting buyers may be regaining control after prior weakness. Traders are closely monitoring this key support-resistance flip zone.
Source: Whale_Crypto_Trading’s X Post
In case the retest is successful, the pattern will signal the continuation of the uptrend, with technical expectations being for a possible move towards $0.50.
Failure to hold this level, on the other hand, might result in the invalidation of the setup and postpone any continuation of the trend.
SEI Technical Indicators Point to Bearish Pressure
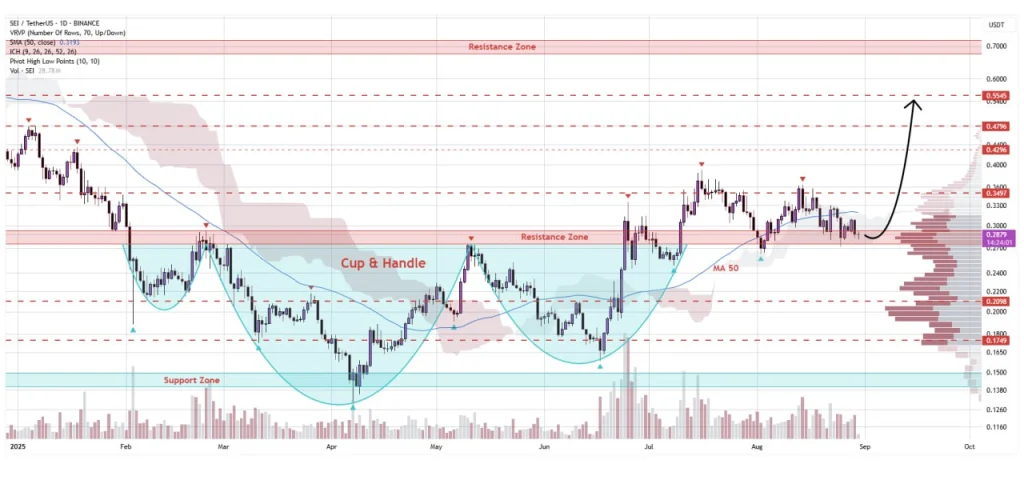
According to TradingView, there is a downward trend in the SEI’s long-term graph, which has currently turned in a consolidation pattern.
The Bollinger Bands are now contracting due to low levels of volatility, caused by the sharp drop that occurred in March. The current price is close to the middle line SMA at $0.05592, indicating neutral momentum.

Source: TradingView
The MACD indicator is consistent with this conservative view since the signal line is fluctuating close to the zero level, which shows an absence of clear trend direction.
The thin histogram bars are consistent with low market activity and uncertainty. The token needs some trigger to move either convincingly above $0.059 or test the lower support at $0.053.
This article contains market analysis and price predictions. These are not guarantees. Crypto markets are volatile. Always DYOR. Not financial advice.
Also Read: SEI Holds Descending Channel Support as Analysts Eye $0.10 Break

Be the first to comment