


What to know:
- Litecoin (LTC) holds above descending triangle support, signaling a potential breakout in the coming sessions.
- RSI (61.07) and bullish MACD crossover confirm strengthening momentum without overbought conditions.
- Key resistance levels sit at $63, $85, and $115, with higher upside targets if momentum continues.

Litecoin (LTC) is moving in an upward consolidation phase with a reversal in sight as the token holds above the lower boundary of the descending triangle. However, the LTC price action is also supported by rising volume, but declining open interest points to cautious optimism. According to CoinMarketCap, as of Wednesday, May 6, LTC is currently trading at $57.04, with a 24-hour gain of 2.65%.
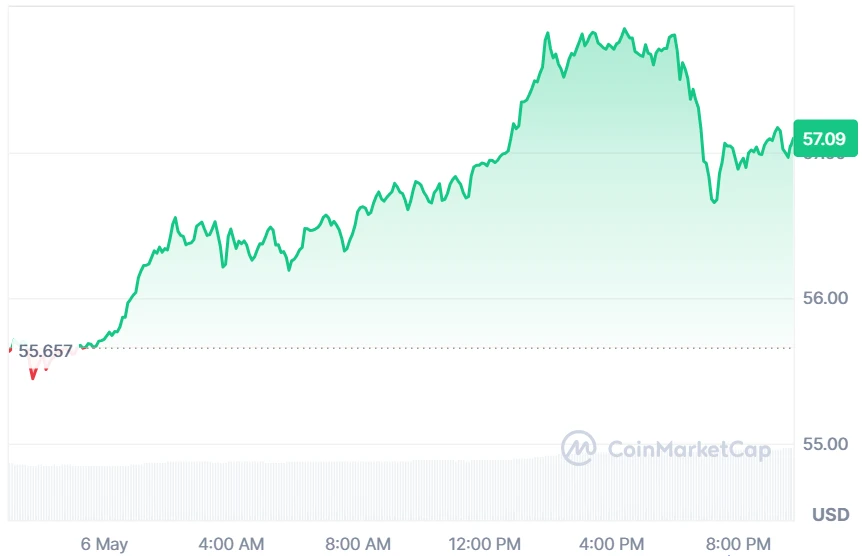

Source: CoinMarketCap
Litecoin Derivative Data Points to Mixed Sentiment
According to Coinglass, trading volume surged by 23.60% to $416.22 million, signaling stronger participation and liquidity inflows. However, despite this activity, the breakout in LTC price action is not yet fully confirmed due to conflicting positioning trends.


Source: Coinglass
Open interest fell by 5.42% to $383.87 million, reflecting reduced market exposure. This divergence adds complexity to the LTC price action, as traders appear to be participating more actively while simultaneously reducing leveraged commitments.
Also Read: Litecoin Price Prediction: LTC Holds Critical Support as Upside Momentum Builds
LTC Price Action Points to a Strong Rally to $285
Furthermore, the crypto analyst Jonathan Carter highlighted that LTC is showing notable resilience as it consolidates above the lower boundary of a descending triangle pattern on the weekly chart.
This key support zone has been tested multiple times, yet price continues to hold firm. Such stability suggests that selling pressure is weakening, while early signs of accumulation hint at growing confidence among longer-term market participants.
If the LTC price action remains bullish, there will be room for an organized bounce, with potential upside targets of $63, $85, and $115 in the first instance.
Further upside targets of $140, $180, and perhaps $285 might be considered if bullish momentum continues to build up. But confirmation of the breakout is necessary since Litecoin stands at a decisive crossroads at present.
Momentum Indicators Support Improving Outlook
However, technical indicators give an additional boost to the LTC price action. The Relative Strength Index, as per TradingView, is currently sitting at 61.07. With such values, the RSI suggests that there is no sign of an overbought market yet, despite the strong bullishness.

Source: TradingView
At the same time, the moving average convergence divergence indicator generates a new bullish cross, as indicated by the transition of histogram bars into the positive territory.
The development supports the LTC price action due to the growing dominance of buyers after a period of consolidation.
This article contains market analysis and price predictions. These are not guarantees. Crypto markets are volatile. Always DYOR. Not financial advice.
Also Read: Litecoin (LTC) Holds Range as Accumulation Signals Possible $500 Breakout

Be the first to comment