

Bitcoin’s recent price action suggests the market is approaching an important decision zone where multiple technical and on-chain support levels converge. This raises the possibility of a short-term bullish reaction before the market determines its next larger directional move.
The behavior around the $74K-$75K support and deeper demand regions will likely shape Bitcoin’s medium-term outlook.
Bitcoin Price Analysis: The Daily Chart
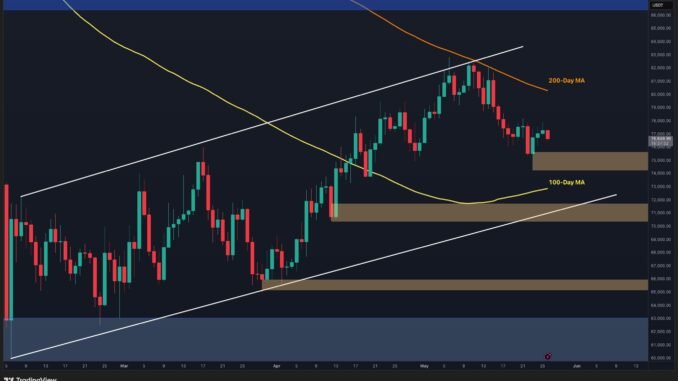
On the daily timeframe, BTC continues to trade below the descending 200-day MA around $80K while struggling to build bullish momentum. Following rejection from the $82K resistance area, sellers pushed the market back toward the first major support zone at $74K-$75K.
This region carries increased importance because it aligns with prior demand, recent local lows, and sits above the 100-day MA near $73K. Historically, overlapping support levels often generate temporary stabilization or corrective rebounds.
The immediate scenario favors a pullback toward the $74K-$75K demand zone. If buyers defend this region successfully, Bitcoin may attempt another corrective move toward $78K-$80K. However, losing the $74K support could expose the next key level around $70K-$71K, followed by the stronger structural support near $65K-$66K.
At this stage, price remains in correction mode rather than a confirmed trend reversal.

BTC/USDT 4-Hour Chart
The lower timeframe highlights increasing indecision near support. Bitcoin recently reacted positively from the $74K-$75K order block and briefly recovered toward $77K, suggesting buyers remain active around this area.
Still, bullish momentum has remained weak, with rebounds repeatedly failing to reclaim higher resistance levels. This indicates that current upward movements may represent temporary relief rallies rather than renewed trend continuation.
The short-term support sits at $74K-$75K. Holding above this zone could encourage another recovery attempt toward the $78K-$80K region. Conversely, a confirmed breakdown below $74K may accelerate selling toward the next major demand area around $70K-$71K.
Therefore, the reaction at current support levels remains critical for determining whether Bitcoin enters stabilization or another bearish leg.

On-Chain Analysis
The UTXO Realized Price Bands provide additional context by tracking the average acquisition cost of different investor cohorts. These levels often act as psychological support or resistance because they reflect where holders become profitable or begin experiencing losses.
Currently, the 1M–3M cohort realized price sits near $70K, while the 18M–2Y cohort remains around $63K. Meanwhile, longer-term holders between 12M–18M and 3M–6M maintain realized prices closer to the $90K region.
The significance lies in the confluence between technical supports and realized price bands. Bitcoin’s first major support zone around $70K-$71K aligns closely with the realized price of younger holders (1M–3M), strengthening the probability of demand emerging in this area.
A deeper decline toward $63K-$65K would also coincide with the realized price of longer-term cohorts around $63K, alongside an important historical support zone visible on the daily chart.
This suggests that if Bitcoin continues correcting, support levels at $74K-$75K, $70K-$71K, and eventually $63K-$65K may attract increasing buying activity. The market’s reaction around these zones will likely determine whether the current pullback evolves into accumulation or transitions into a broader bearish continuation.
For now, the data points toward short-term support potential rather than immediate trend recovery.

Binance Free $600 (CryptoPotato Exclusive): Use this link to register a new account and receive $600 exclusive welcome offer on Binance (full details).
LIMITED OFFER for CryptoPotato readers at Bybit: Use this link to register and open a $500 FREE position on any coin!
Disclaimer: Information found on CryptoPotato is those of writers quoted. It does not represent the opinions of CryptoPotato on whether to buy, sell, or hold any investments. You are advised to conduct your own research before making any investment decisions. Use provided information at your own risk. See Disclaimer for more information.





Be the first to comment