


What to know:
- AAVE retests long-term support in a descending channel, with RSI divergence signaling weakening bearish momentum.
- MACD remains flat with weak momentum, reflecting market indecision and lack of strong buying or selling pressure.
- Aave V4 shows steady loan growth and rising adoption, strengthening its long-term fundamental outlook.

AAVE shows potential local bottom as price retests key support within a long-term descending channel, with RSI divergence suggesting weakening downside momentum for the AAVE price. It is consolidating with low volatility and a flat MACD, while Aave V4 sees steady loan growth and rising adoption.
At the time of writing, AAVE is trading at $88.31 with a 24-hour trading volume of $192.3 million and a market capitalization of $1.36 billion. Following the signs of stability over the last 24 hours, now everyone’s focus is on whether AAVE can maintain its momentum.


Source: CoinMarketCap

AAVE Price Divergence Hints at Local Bottom
According to the crypto analyst Scient, the AAVE price is retesting a key technical support zone after an earlier scalp trade failed to evolve into a swing move.
The AAVE price is now sitting at the value area low of a major daily range, which also aligns with the lower boundary of a long-standing descending channel since late 2024, forming strong confluence.
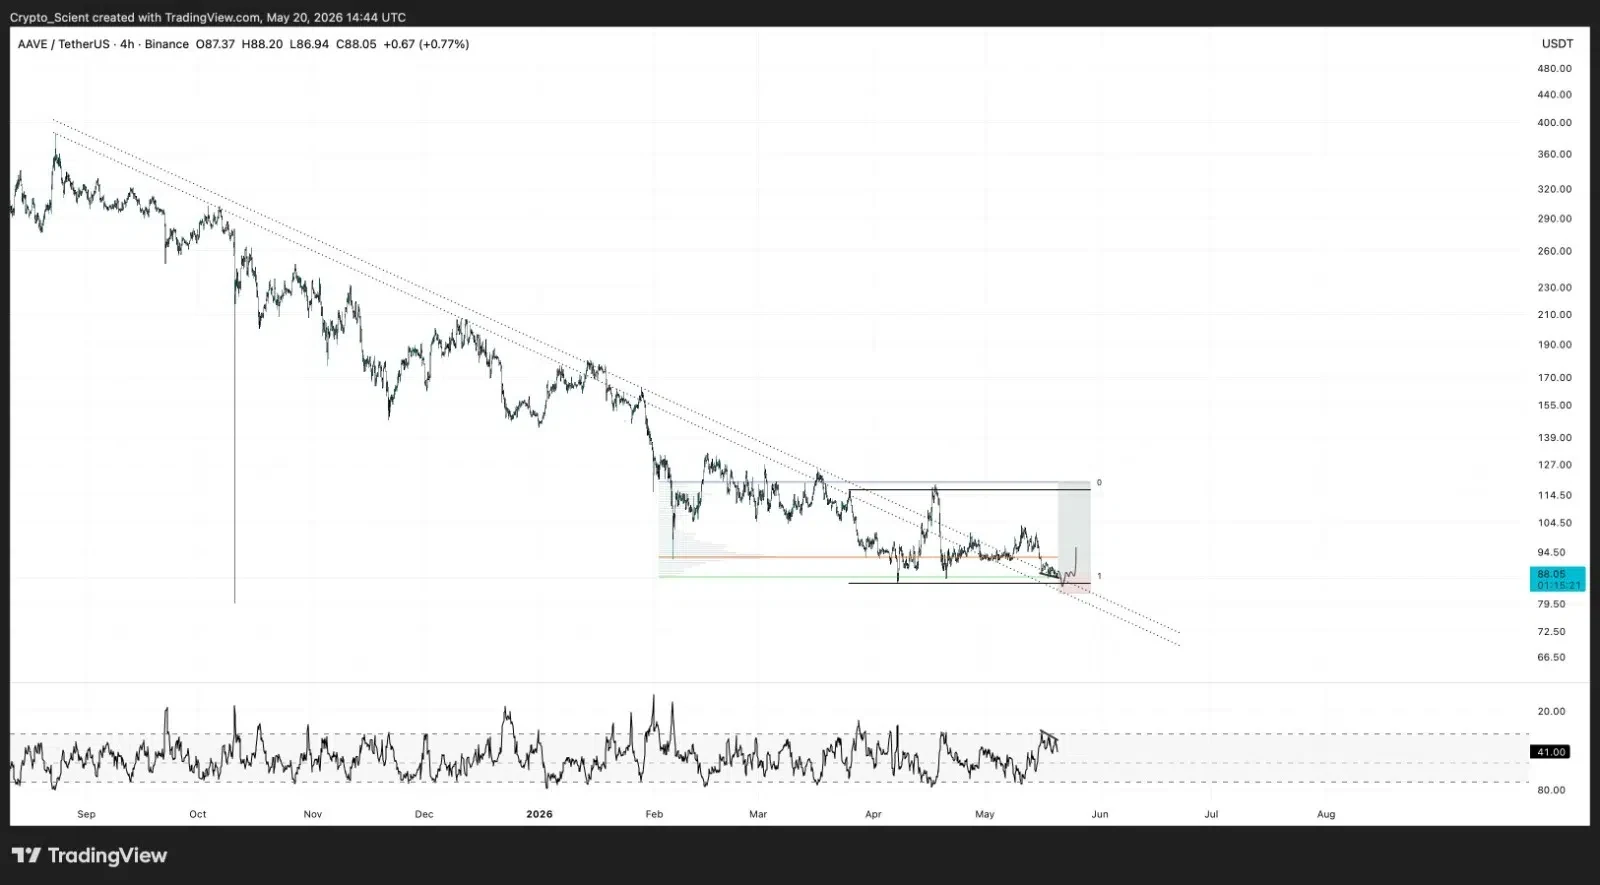

Source: Scient’s X Post
For the short term, there are indications that a three-drive formation is possible, alongside bullish RSI divergence on the 4H timeframe, which could mean that there is waning downward pressure on the AAVE price.
Even though this could imply the end of a downtrend, traders have not ruled out a liquidity sweep below the support level.
AAVE Technical Indicators Point to Tight Consolidation
According to TradingView, the AAVE price has entered into a prolonged bear phase, which has now transitioned into consolidation.
The AAVE price is hanging on to the lower Bollinger Band at $85.91, which is acting as a strong support level. The tightening of the upper bands indicates that the volatility has fallen dramatically, like the coils of a spring, prepared to break free soon.

Source: TradingView
The MACD signal matches this slowdown, as the lines sit flat and far in negative territory. The barely visible histogram bars show subdued buying pressure from both sides.
A breakout through the 20-day SMA level of $93.69 or an outright MACD crossover would kick-start the next major trend move for the AAVE price.
Aave V4 Model Drives Consistent Loan Growth
The data from Kolten further highlighted that since the launch of Aave V4, active loans on the protocol have increased weekly, reflecting steady traction despite the conservative approach adopted in terms of caps placed on borrowing and supplies.
While ensuring security is key to mitigating risk on the platform, its user-friendliness makes it an attractive platform for individuals seeking a stable network.

Source: Kolten’s X Post
A consistently rising trend of utilization in borrowing from Aave V4 points to initial success owing to its new market structure and stringent risk-management policies.
Despite limited exposure, people are increasingly turning towards Aave V4 as a platform. At this rate, Aave V4 has the potential to become a fundamental lending platform in decentralized finance.
This article contains market analysis and price predictions. These are not guarantees. Crypto markets are volatile. Always DYOR. Not financial advice.
Also Read: AAVE Price Climbs 4% As Falling Wedge Signals Breakout Setup
Be the first to comment