


On the 24th of July, a whale transferred 191,453,164 USD Coin [USDC] into the Aave protocol.
Whale Alert valued the transaction at $191.42 million. The transfer confirmed sizable protocol activity, although its effect on AAVE demand remained unclear.
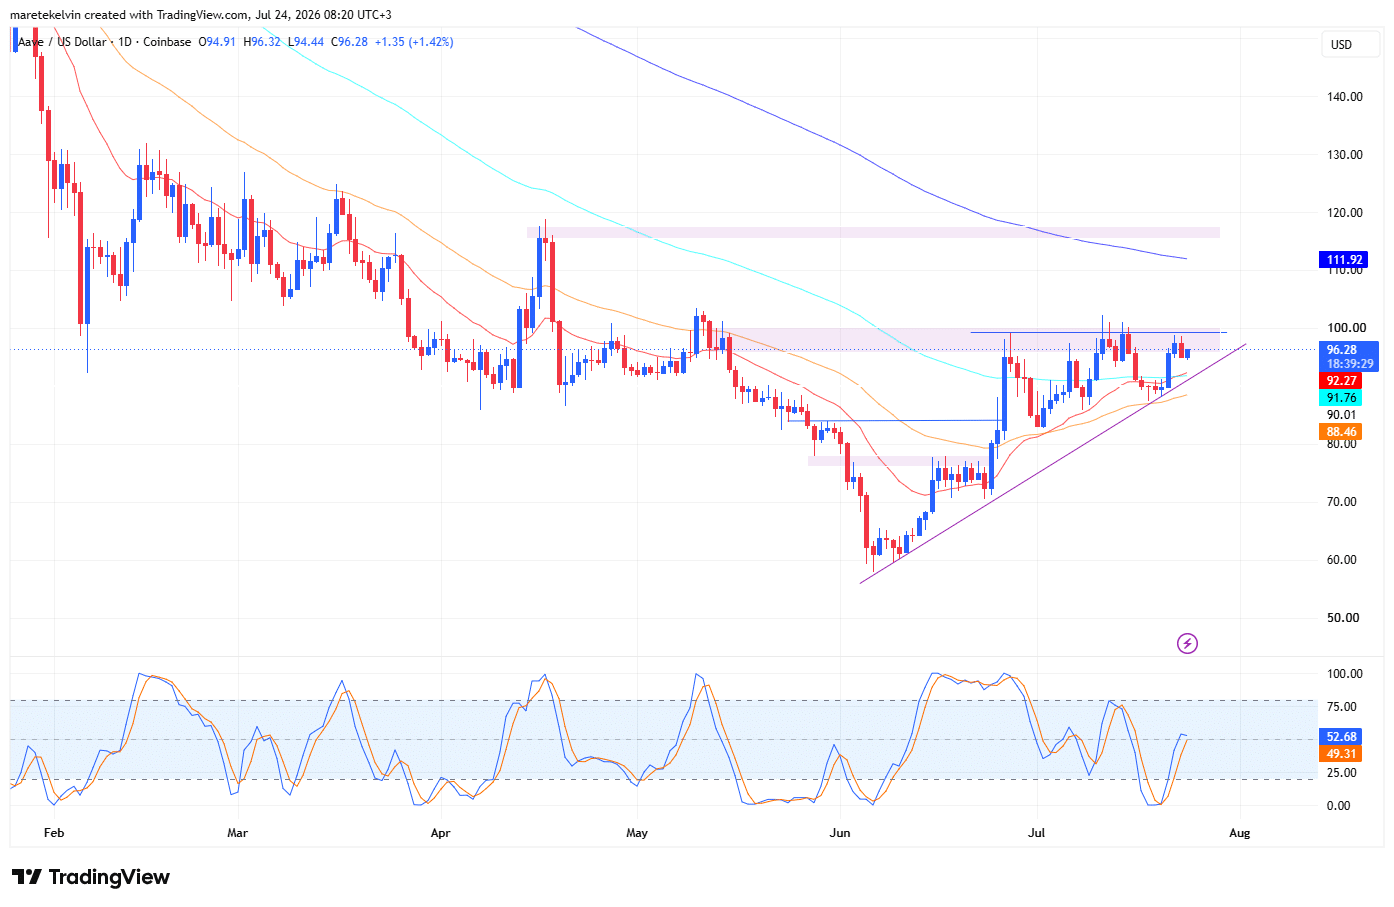
Meanwhile, Aave [AAVE] traded at $96.28, just below the resistance around $99–$100. This zone had rejected several recovery attempts, making the whale’s timing particularly notable.
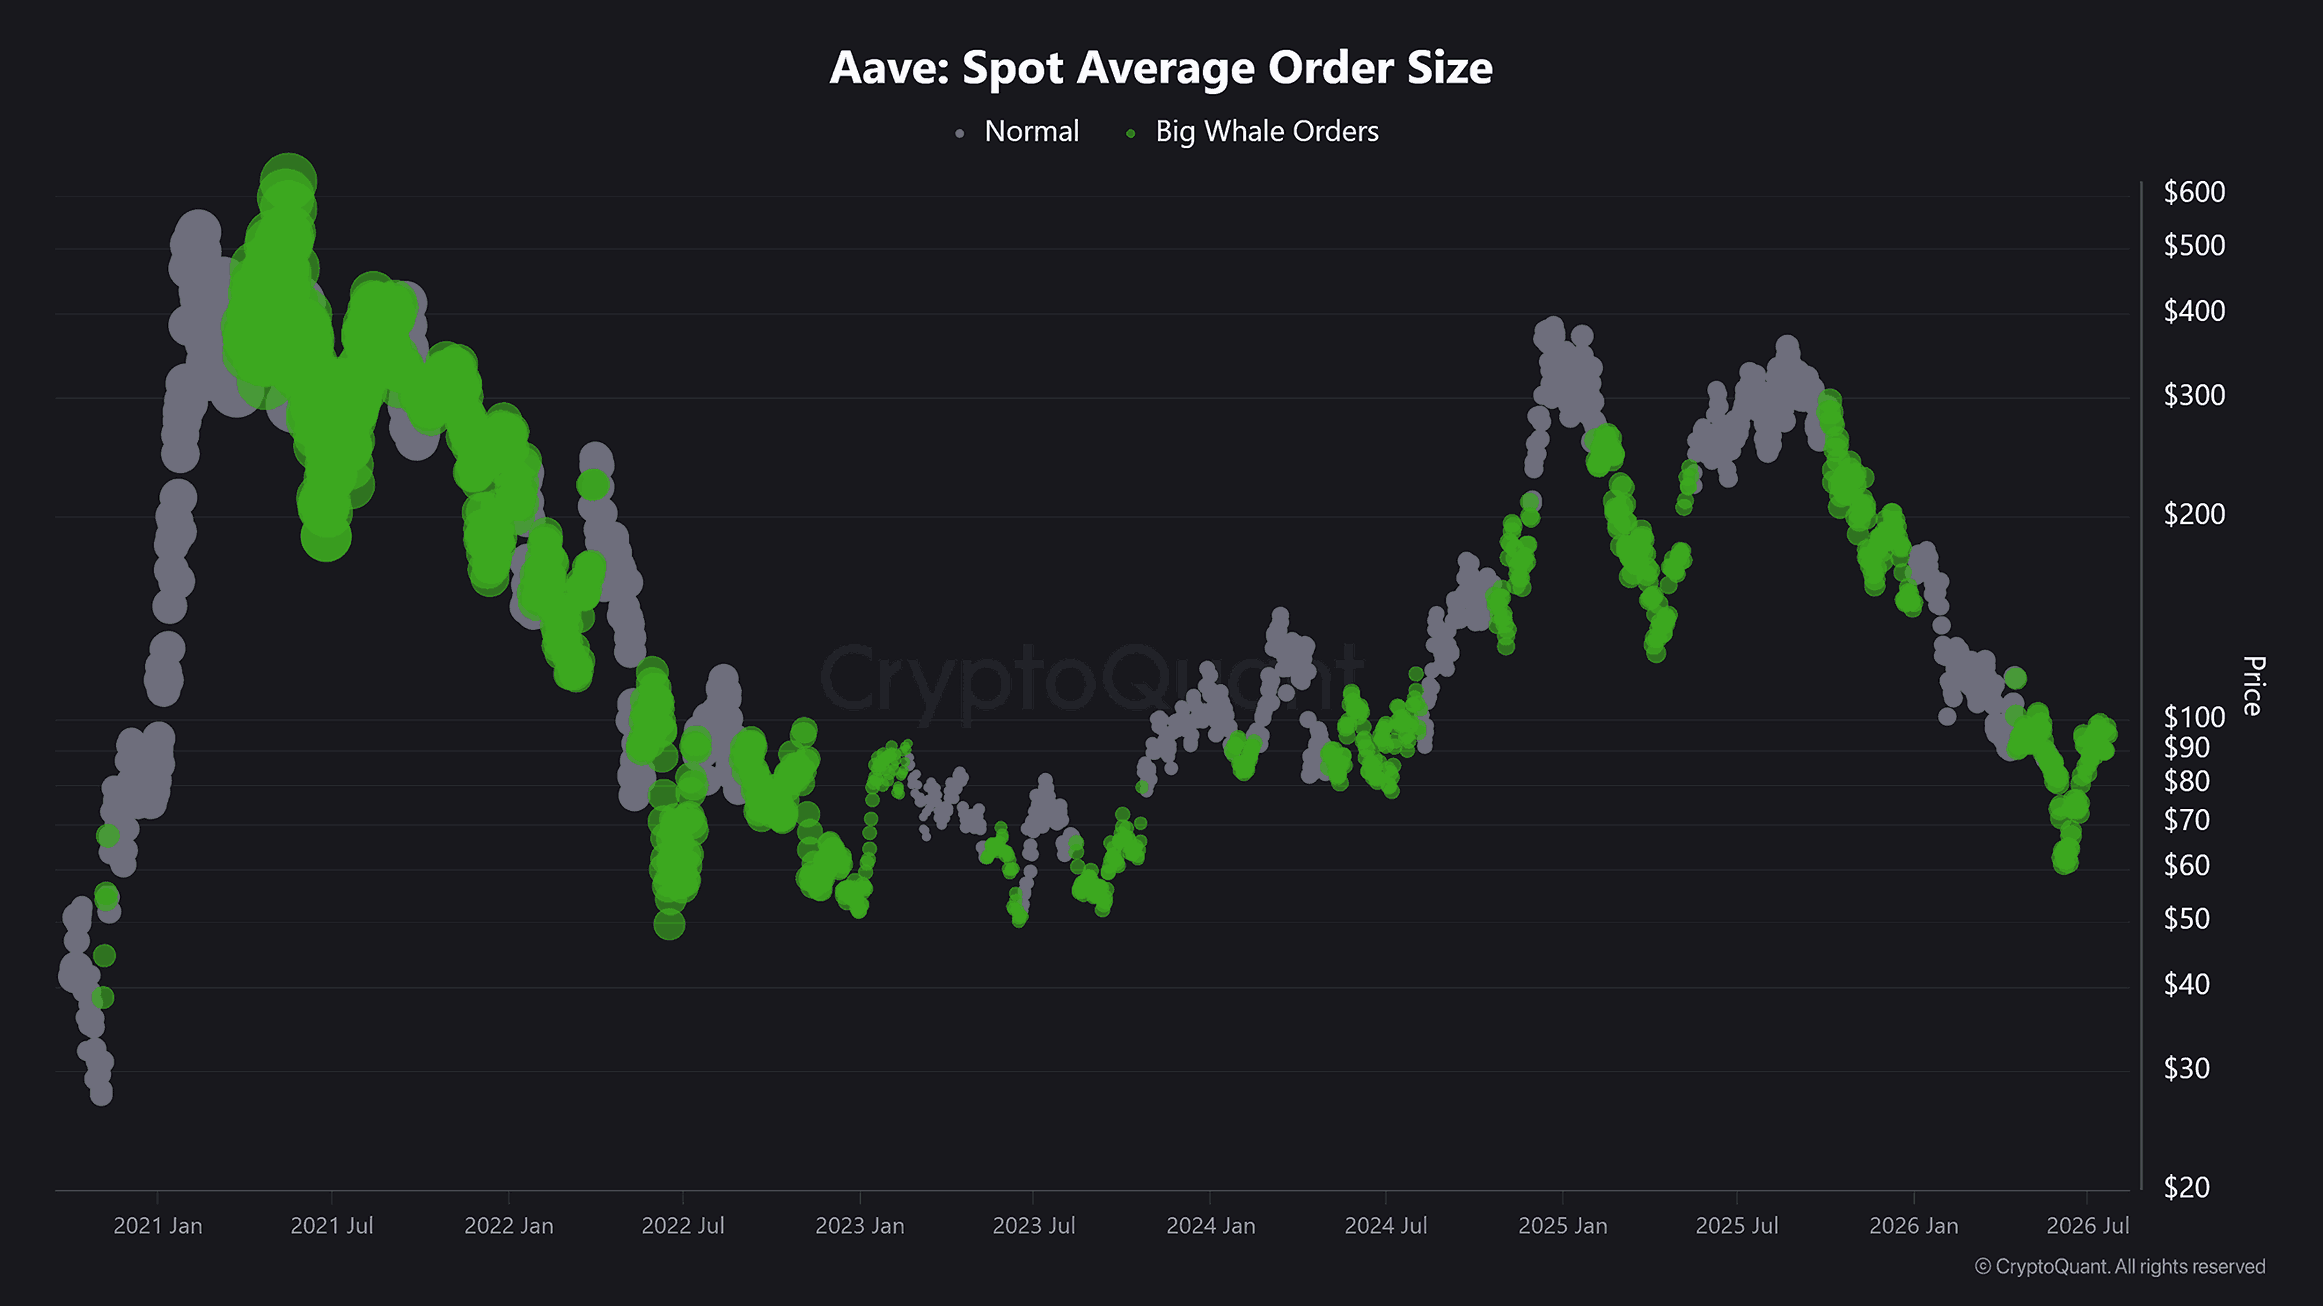
CryptoQuant’s Spot Average Order Size also recorded Big Whale Orders near AAVE’s current price range. However, neither dataset confirmed that these whales bought AAVE ahead of a breakout.

Are whales positioning before $100?
The USDC transfer was part of a broader increase in large transactions.
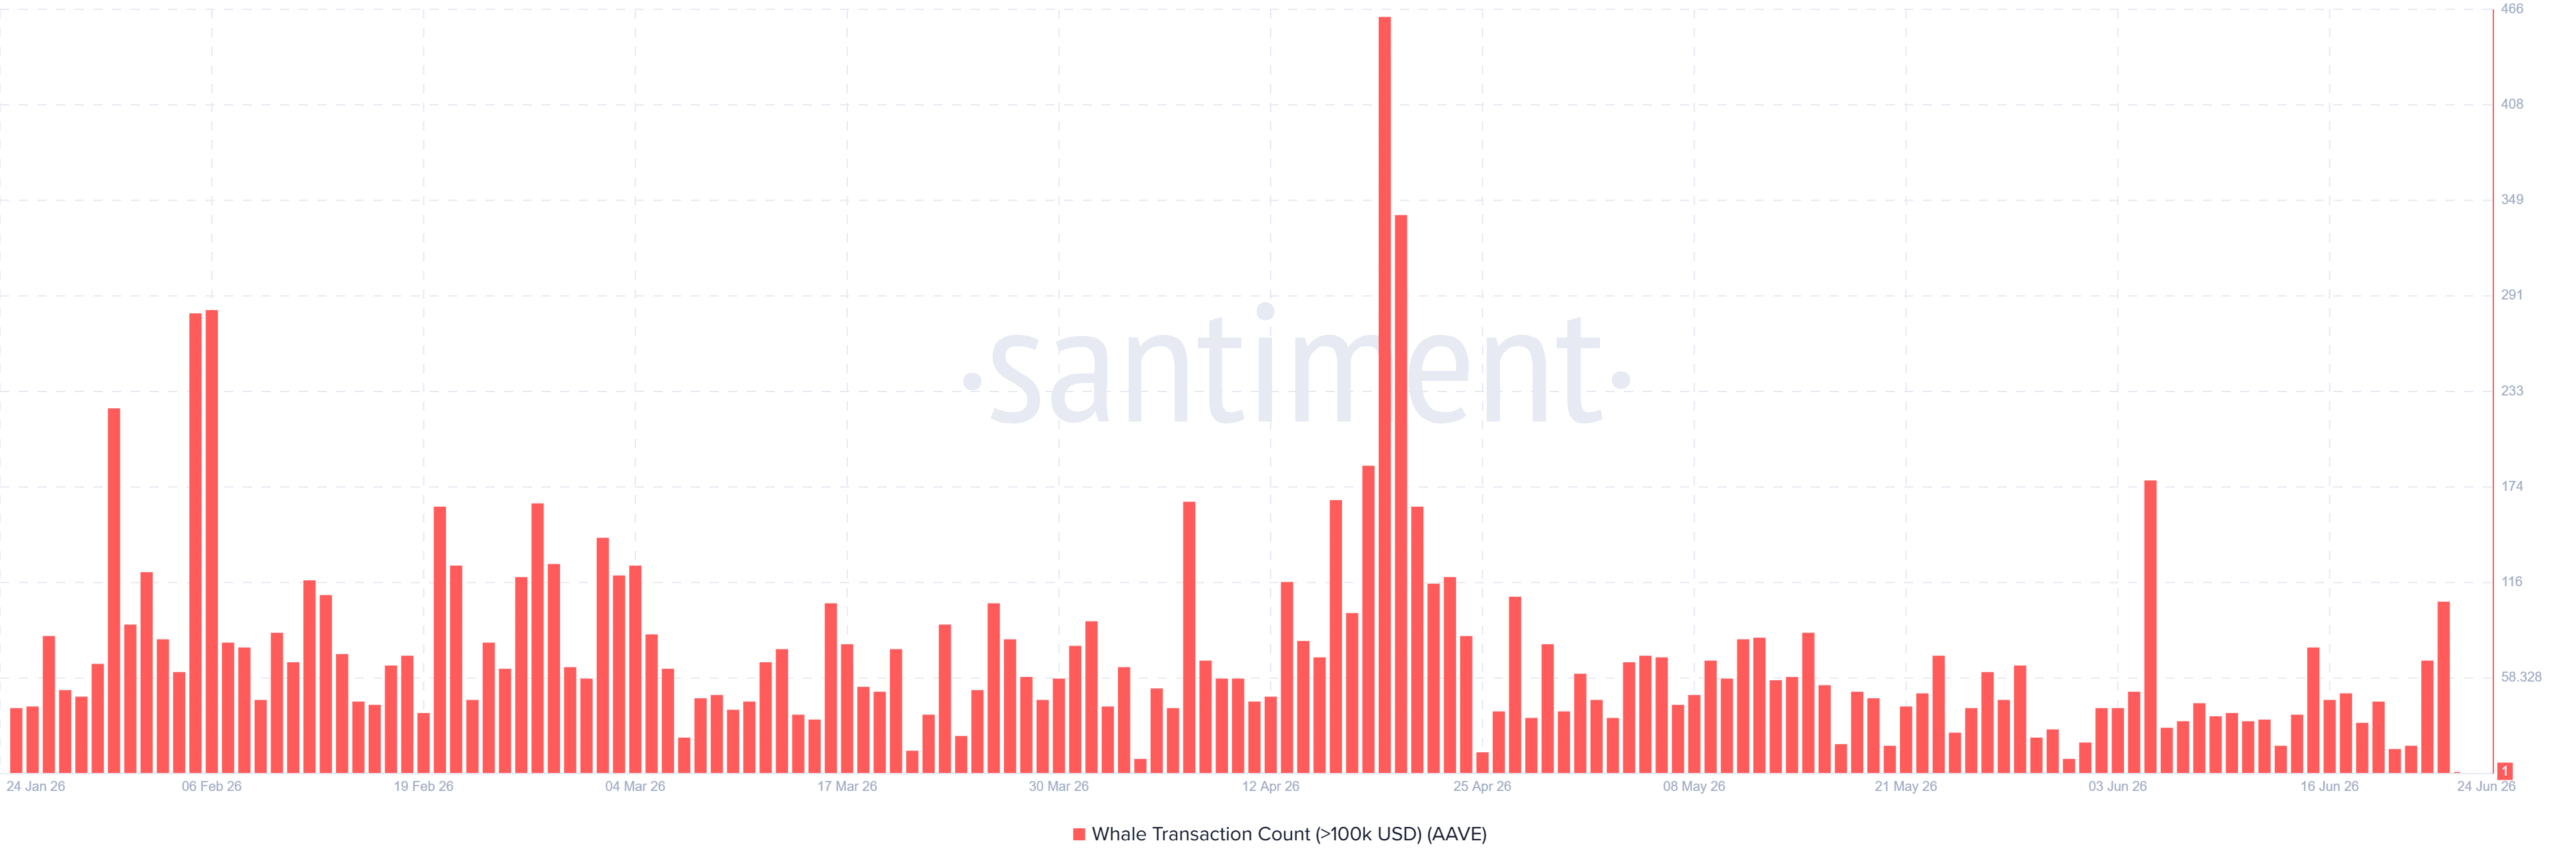
Santiment recorded a rise in Whale Transaction Count for transfers exceeding $100,000 before the latest partial reading. This activity suggested renewed interest from large holders. However, the metric included purchases, sales, and wallet transfers.
Consequently, a higher Whale Transaction Count could increase volatility without determining its direction.
Spot demand offered a clearer bullish signal.
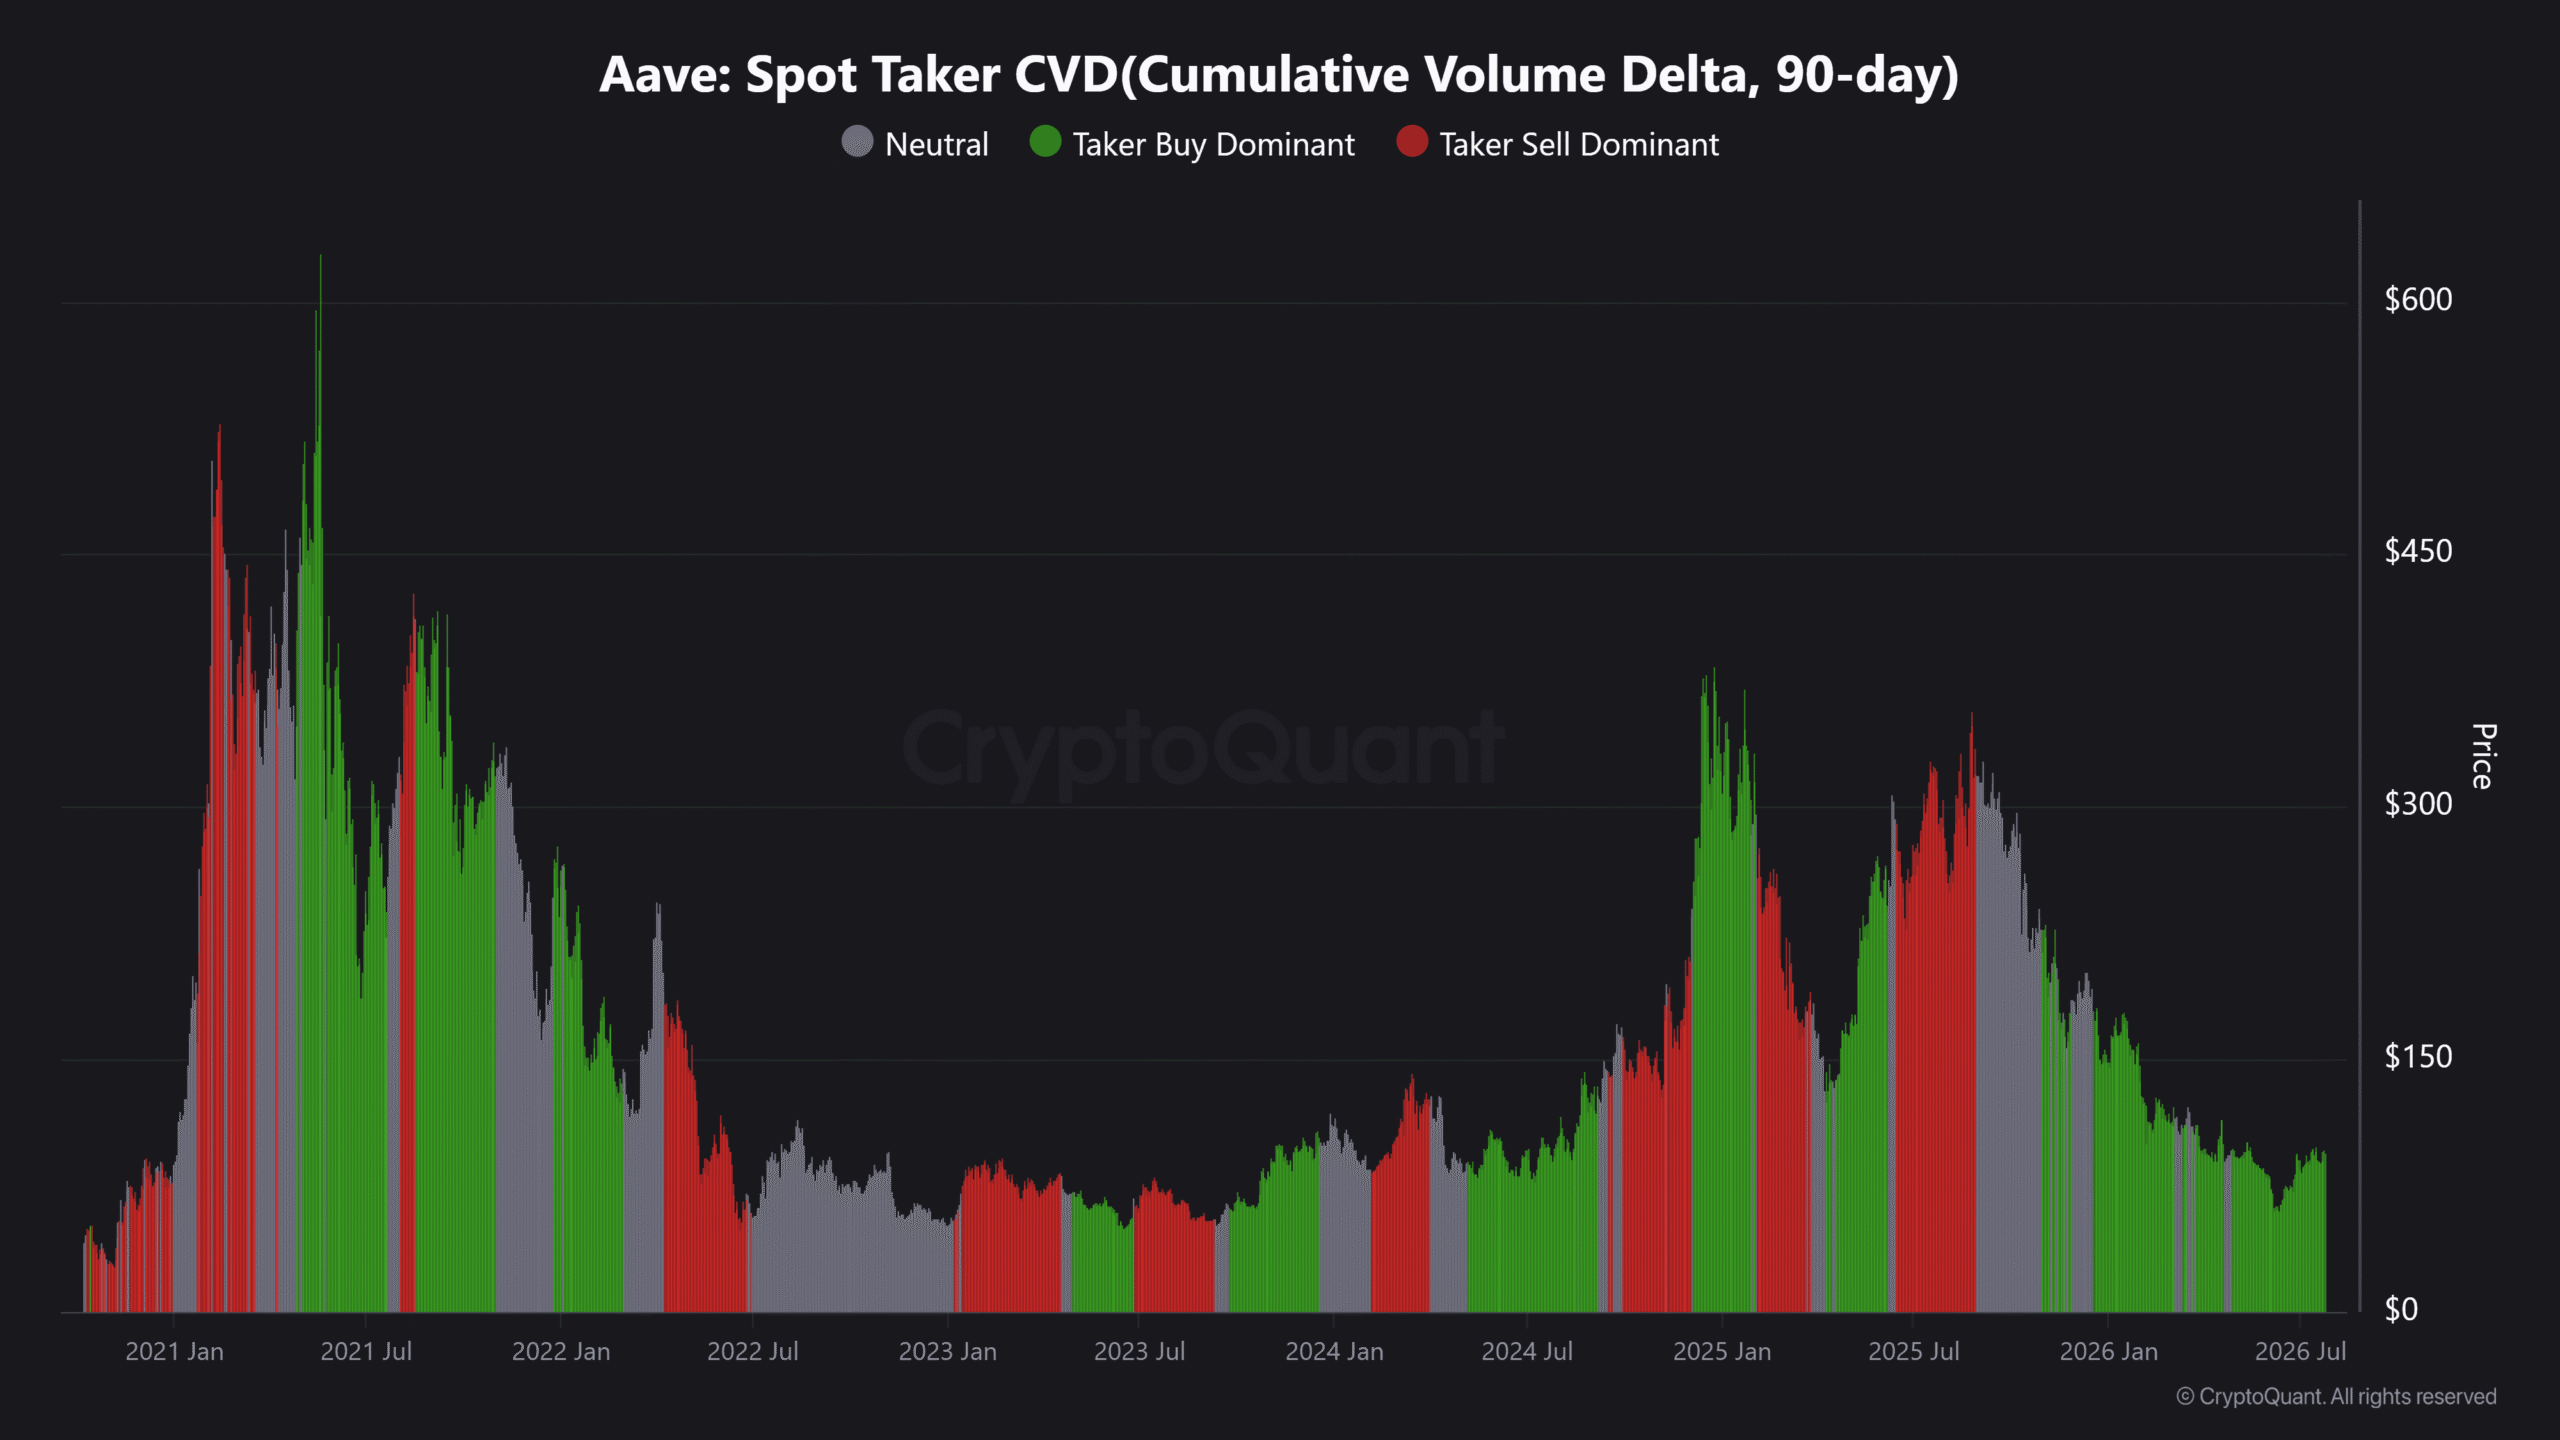
CryptoQuant’s 90-day Spot Taker CVD showed Taker Buy Dominant activity during AAVE’s latest recovery. This indicated that aggressive spot buyers had increasingly crossed the spread to complete purchases.
Coinalyze data supported that positioning. Longs represented 56.09% of one-day positions, compared with 43.79% for shorts.
The one-day Long/Short Ratio stood at 1.28. Still, crowded long positioning could increase liquidation risk during a rejection.
Can AAVE break above $100?
AAVE had consolidated beneath $100 after recovering from its June lows.
The daily chart formed an ascending triangle, with buyers defending a rising trendline beneath horizontal resistance.
AAVE also traded above its 20-day, 50-day, and 100-day Exponential Moving Averages. Those averages stood near $92.27, $91.76, and $88.46, respectively.
Meanwhile, the Stochastic RSI recorded values of 52.68 and 49.31. These neutral readings left room for movement in either direction.
A confirmed daily close above $100 could strengthen the breakout case. Rejection may return attention to the moving averages below $92.
Final Summary
- Whale activity increased as AAVE consolidated beneath the psychologically important $100 resistance.
- Buy-dominant spot flow strengthened AAVE’s breakout case without confirming the move.




Be the first to comment