


What to know:
- SUI is in a quiet accumulation phase, with steady buying interest despite weak momentum and price below key moving averages.
- A bearish structure persists as SUI stays under the 20, 50, and 100-day EMAs, with RSI near oversold, signaling weak demand.
- Analysts highlight an accumulation zone between $0.60 and $0.90, where larger players may be positioning ahead of a breakout.

Sui (SUI) is in a quiet accumulation phase with gradual buying interest but limited hype. The broader trend remains bearish, with the SUI price under key moving averages and weak momentum. Trading activity is rising while open interest declines, suggesting cautious sentiment. Direction depends on future demand and liquidity.
At the time of writing, SUI is trading at $0.8731 with a 24-hour trading volume of $423.28 million and a market capitalization of $3.49 billion. Despite the 3.86% loss over the last 24 hours, the SUI price accumulation points to a bullish reversal ahead.

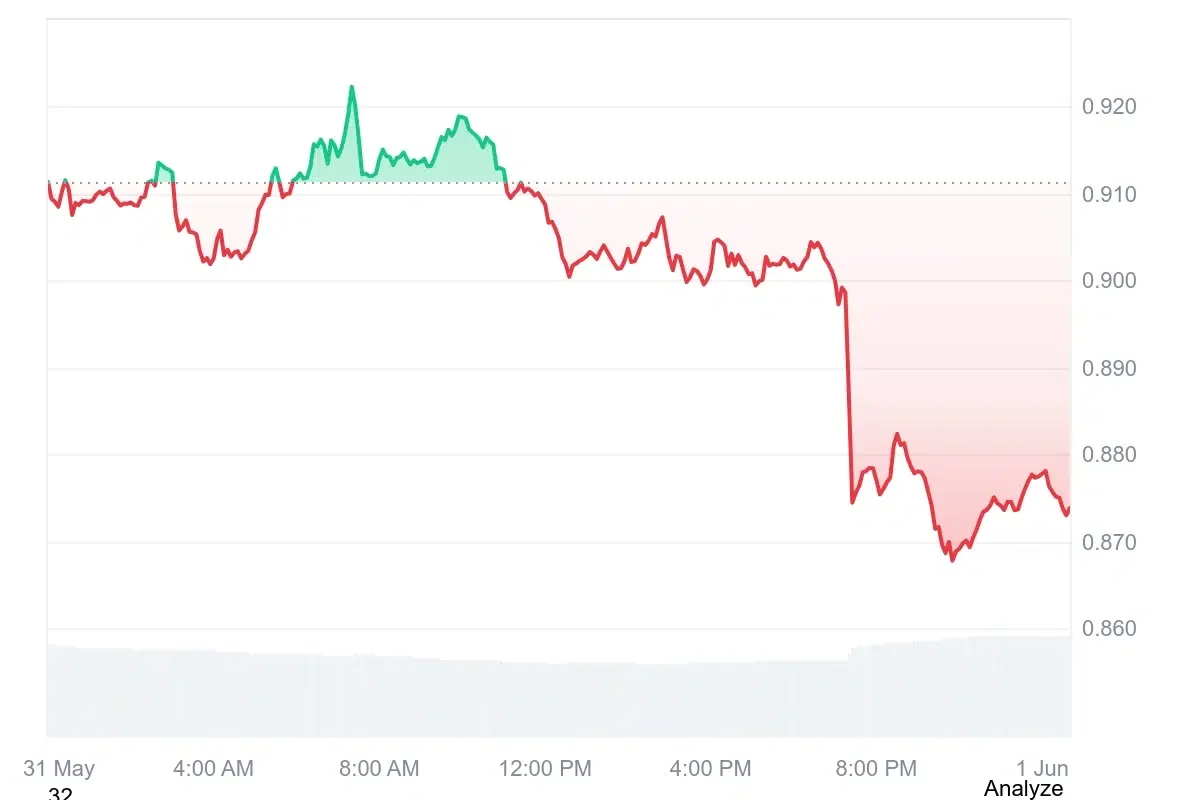
Source: CoinMarketCap

SUI Price Accumulation Points to $20 Breakout
Furthermore, the crypto analyst Crypto Patel highlighted that SUI is showing a rare market pattern of quiet, steady accumulation with little hype or retail attention.
Instead of sharp pumps or social media-driven volatility, the SUI price action reflects gradual buying pressure building in the background. Traders interpret this as potential positioning by larger players, often seen during early base-building phases before major moves.

Source: Crypto Patel’s X Post
Market analysts note the consolidation trend within the $0.60 to $0.90 range, although future prospects remain hazy. While highly ambitious dreams of $5, $10, and even higher targets around $20 may seem enticing to retail investors, they do not guarantee any forecast.
At present, the SUI price seems to be in the midst of a subdued period, and its future is contingent on several factors.
Also Read: Sui Blockchain Swiftly Resumes After Critical 6-Hr Outage
Technical Indicators Point to Bearish Dominance
According to TradingView, the SUI price shows an evident sustained downtrend, but now it is followed by a solid consolidation phase, which is followed by another downtrend.
After breaking out in mid-May and approaching its 200-day EMA at $1.40, the token met with strong rejection, which took the SUI price to as low as 0.87512.
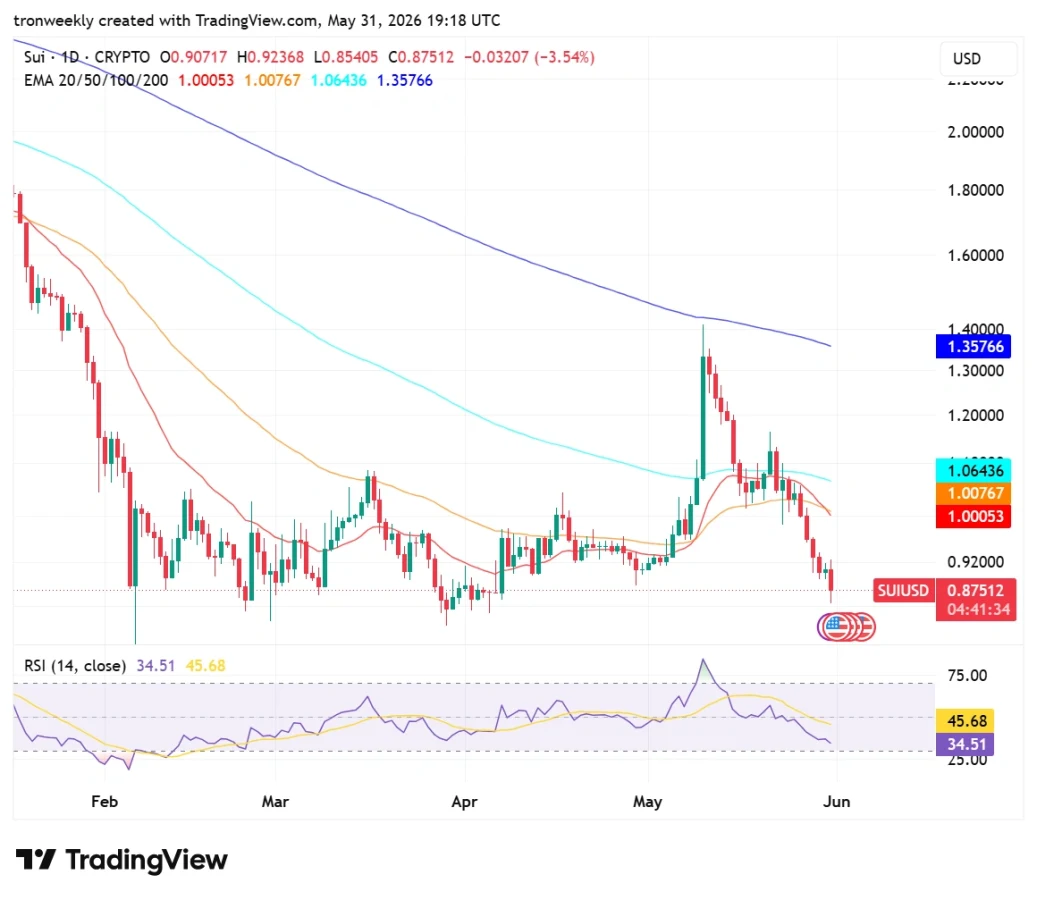
Source: TradingView
The SUI price is trading below its 20-day, 50-day, and 100-day EMA levels, where resistance is strengthening due to the downward move in the average prices.
In addition, the RSI indicator, which was previously trading at overbought territory, has fallen from that level to 34.51, trading near the 30 threshold level.
Rising Open Interest Point to a Bullish reversal Ahead
However, the volume of SUI increased to 28.20%, making it worth $740.54 million. This implies an increase in market activity and participation, which can be an indication that traders are showing interest in the asset.


Source: Coinglass
Open interest declined by 4.17% to reach $705.03 million. This indicates that there are fewer positions held and may also imply that some traders are taking profits. It might be indicative of a conservative approach as traders either reduce their positions or leverage.
This article contains market analysis and price predictions. These are not guarantees. Crypto markets are volatile. Always DYOR. Not financial advice.
Also Read: SUI Price Shows Early Reversal Signs with Target Move Toward $0.97 – $1.00 Resistance

Be the first to comment