



Arbitrum (ARB) has moved out of its prior ascending channel and now trades between rising support from the 50-day SMA and a descending trendline near $0.196. The next daily close could determine whether the rebound extends toward $0.212 or turns back toward $0.163.
ARB has exited its ascending channel
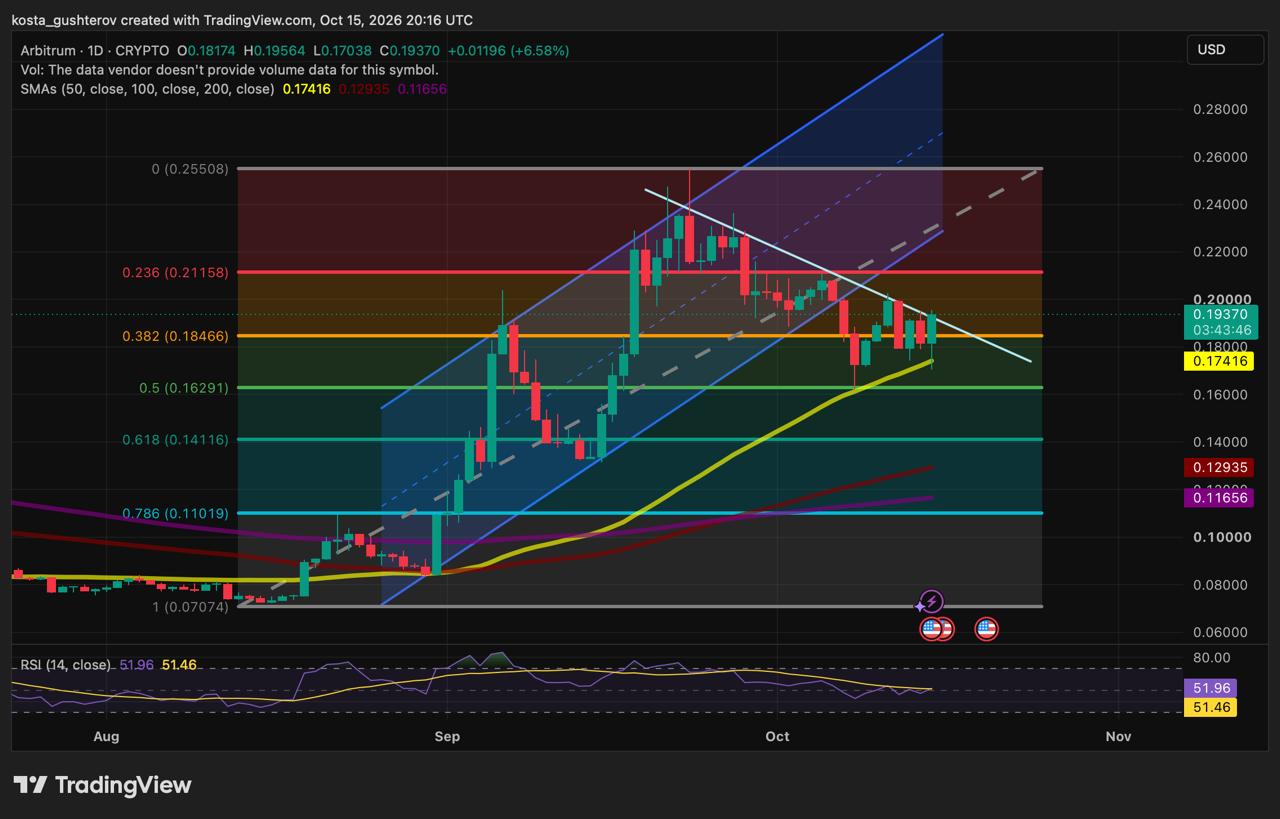
ARB had previously advanced inside a clear ascending parallel channel. A sequence of lower highs and lower lows then pushed the price below the channel’s lower boundary, ending the immediate multi-week rising structure.
After the channel break, ARB formed a descending resistance trendline connecting the swing high near $0.255 with lower reaction highs through late September and October. This trendline now defines the local downtrend.
The latest daily candle pushed toward that diagonal resistance near $0.196 but met selling pressure, leaving an upper wick. ARB was trading around $0.194 at the time of analysis, up roughly 6.6% on the day, but the descending line still caps the recovery.
The 50-day SMA and $0.185 Fib are holding the range together
Below the price, the 50-day simple moving average sits near $0.174 and continues to slope upward. Recent wicks toward $0.170 found buying interest around this average, making it the main dynamic support beneath the current range.
The $0.185 level, which marks the 0.382 Fibonacci retracement of the move from approximately $0.07 to $0.25, now acts as the nearest short-term pivot. ARB has recovered above it, placing price in a narrow area between the rising 50-day SMA below and descending resistance overhead.
The immediate range: buyers are defending the $0.174-$0.185 support area, while sellers have so far protected the descending trendline near $0.196-$0.198.
ARB price levels to watch
| Level | Price area | Why it matters |
|---|---|---|
| Macro peak resistance | $0.255 | The 0.00% Fibonacci level and the major swing high of the move. |
| Fibonacci resistance | $0.212 | The 0.236 Fib level and the next horizontal supply area above the trendline. |
| Immediate resistance | $0.196–$0.198 | The descending trendline that has capped recent daily rallies. |
| Short-term pivot | $0.185 | The 0.382 Fib level, recently reclaimed by ARB. |
| Primary support | $0.174 | The rising 50-day SMA, which has caught recent pullbacks. |
| Secondary support | $0.163 | The 0.500 Fibonacci retracement level. |
| Golden Pocket support | $0.141 | The 0.618 Fib level and a key deeper retracement zone. |
| Moving-average base | $0.117-$0.129 | The 200-day SMA near $0.117, 100-day SMA near $0.129 and nearby 0.786 Fib near $0.110. |
Momentum is neutral, leaving the breakout level in focus
The 14-day RSI is near 52, while its signal line sits near 51.5. Both readings are close to the 50 midline, showing that neither buyers nor sellers currently have a decisive momentum advantage.
That neutral position fits the price structure. ARB has rebounded from support, but it has not yet invalidated the descending trendline that followed the channel breakdown.
What could confirm ARB’s next move
Until either level breaks, ARB remains in a tight consolidation range rather than a confirmed new trend.
Upside case: ARB breaks the descending trendline
For a stronger recovery, ARB needs a decisive daily close above the descending resistance area around $0.196-$0.198. A confirmed break would invalidate the local downtrend and put the 0.236 Fib near $0.212 in focus. Above that level, the major swing high near $0.255 becomes the wider upside reference.
Downside case: the 50-day SMA gives way
For the bearish scenario, ARB would need to close below the 50-day SMA near $0.174. That would break the current consolidation range and expose the 0.500 Fib near $0.163. If selling continued, the 0.618 Fibonacci level near $0.141 would become the next major downside area.
Bottom line: ARB has reclaimed $0.185 but remains trapped between rising moving-average support and descending trendline resistance. The daily close around $0.196-$0.198, or a break below $0.174, might provide the clearer signal.
This analysis is provided for informational purposes only and does not constitute financial or investment advice. Technical levels can change as market conditions develop.

Kosta has reported on cryptocurrency markets and blockchain infrastructure since 2020, bringing over six years of hands-on experience in the crypto industry built through daily tracking of markets, trends, and emerging blockchain developments. Specializing in Bitcoin on-chain analysis, institutional ETF flows, and digital asset price action, his work at Coindoo has been cited by other news agencies and consistently covers market developments with a focus on data-driven reporting across Bitcoin, Ethereum, Solana, and XRP.
Over the years, Kosta has contributed to multiple crypto media outlets in different regions, authoring over 6,000 articles across the sector. His reporting spans cryptocurrency markets and the broader fintech industry, tracking not only price action but also the technological and regulatory forces shaping the ecosystem.
To support his analysis, Kosta actively leverages on-chain data and metrics from leading platforms such as Santiment, Glassnode, and CryptoQuant, enabling deeper, evidence-based market insights. He believes in the power of transparency and the data that underpins the blockchain ecosystem.
His academic background in Marketing Management from Denmark further complements his analytical approach, adding a strong understanding of communication strategy and content positioning to his work.



Be the first to comment