


What to know:
- Arbitrum (ARB) trades near $0.117 with weakening short-term momentum
- Loss of $0.11 support could trigger a deeper decline toward lower zones
- Indicators show fading strength as resistance builds near $0.13

Arbitrum (ARB) appears to be showing signs of weakness due to its inability to breach an important level of resistance in terms of price action, leading to fears of an impending sell-off. Traders are keeping their eyes on the technical setup, which suggests that the current technical setup will be able to change the market dynamics within a short period of time.
Arbitrum Holds Ground but Downside Pressure Builds
Arbitrum is currently trading at $0.1174, with a 24-hour trading volume of $116.50 million and a market capitalization of $722.06 million. The token has dropped 3.94% over the past day, reflecting growing hesitation among buyers as price approaches a critical level.
Recent market commentary highlights a bearish “Power of 3” structure forming on the chart. This pattern often signals a setup where price consolidates before making a strong directional move. In this case, the risk leans toward the downside. If Arbitrum fails to hold its current support zone, it could trigger an accelerated move lower into the next demand area.


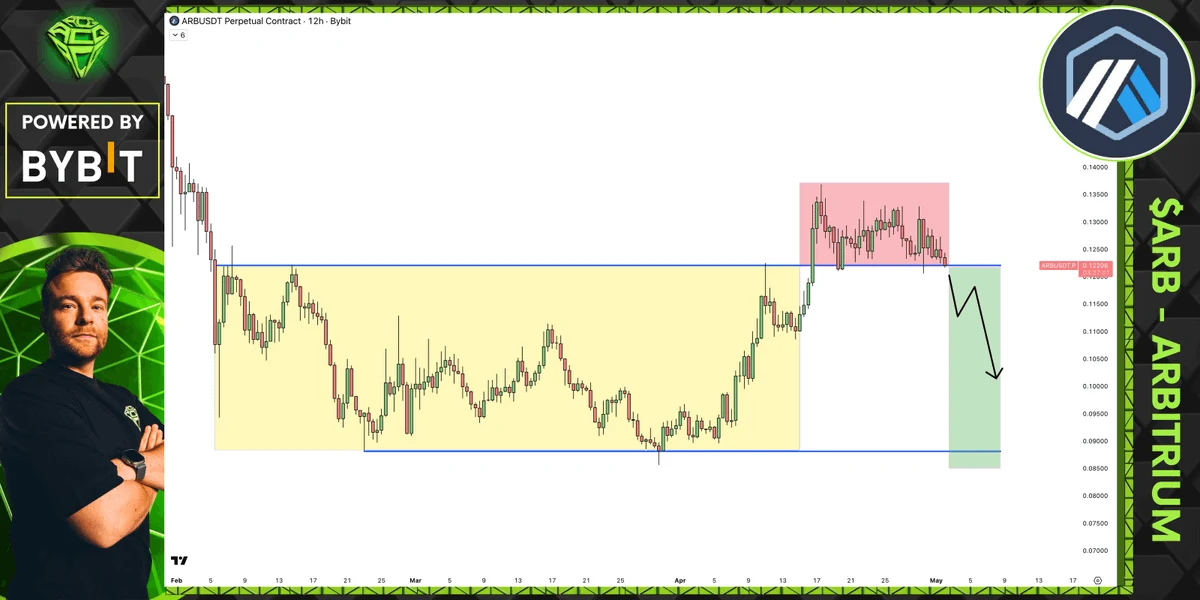
Source: X
Also Read: SushiSwap (SUSHI) Outlook Strengthens: Trendline Break Could Trigger $0.64 Rally
Resistance Near $0.13 Caps Recovery Attempt
From a technical standpoint, the daily chart shows that Arbitrum has been in a prolonged downtrend since failing to hold above the $0.22–$0.23 range earlier this year. A sharp decline followed, with price finding a base between $0.09 and $0.10.
Since then, the token has attempted a gradual recovery, forming higher lows. However, the current upward move is losing strength as it approaches resistance between $0.12 and $0.13. The mid Bollinger Band is acting as a ceiling, while the upper band near $0.135 continues to block further upside progress. Price is now consolidating just below this resistance zone, indicating indecision in the market.
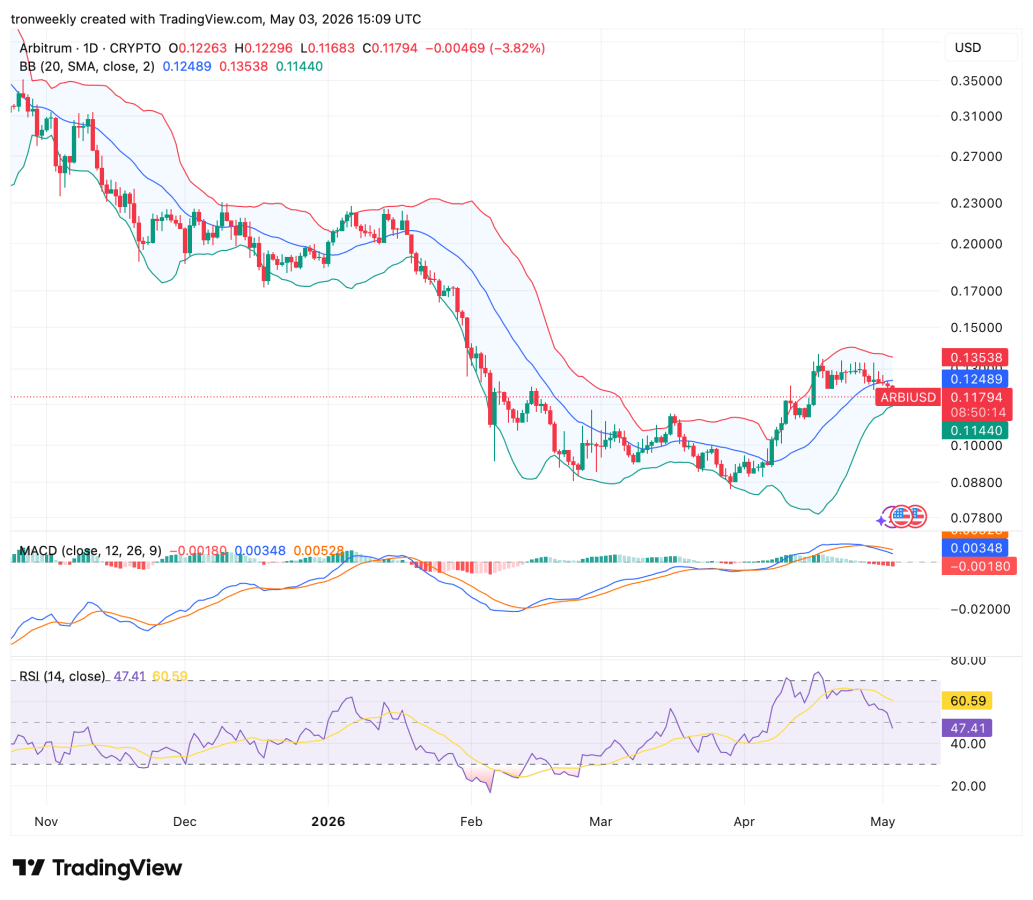
Source: Tradingview
Momentum Indicators Signal Weakening Strength
Indicators have started giving signals in favor of our cautious approach. First, the MACD line is flattening and its histogram has become negative. It implies that the bull run is losing steam. Second, the RSI indicator has decreased sharply from the upper region to below 50, thus reverting to a neutral stance.
Such changes in momentum suggest that there is potential for a temporary halt or retracement. However, if buyers are unable to retake the $0.13 level with strong volume action, then this could further increase the chances of seeing some negative bias emerge from the current formation. Any decline below the $0.11 level would see the stage set for a retest of the $0.10 level or below.
This article contains market analysis and price predictions. These are not guarantees. Crypto markets are volatile. Always DYOR. Not financial advice.
Also Read: Trump Expands Access for Millions of Workers With New Retirement Plans

Be the first to comment