



Litecoin [LTC] was one of the top-20 crypto assets by market capitalization to record a sizeable price gain in the last 24 hours. While many altcoins, including LTC, saw double-digit returns over the past week, most were affected by Bitcoin’s [BTC] pullback from $87.3K to $82.9K by Thursday, 24th September.
At the time of writing, LTC bulls had noted gains of 6.04% in just 24 hours. On the weekly charts too, the altcoin was up by 29.2%, with the altcoin having breached its significant resistance at $60.
A closer look at Litecoin’s long-term trends
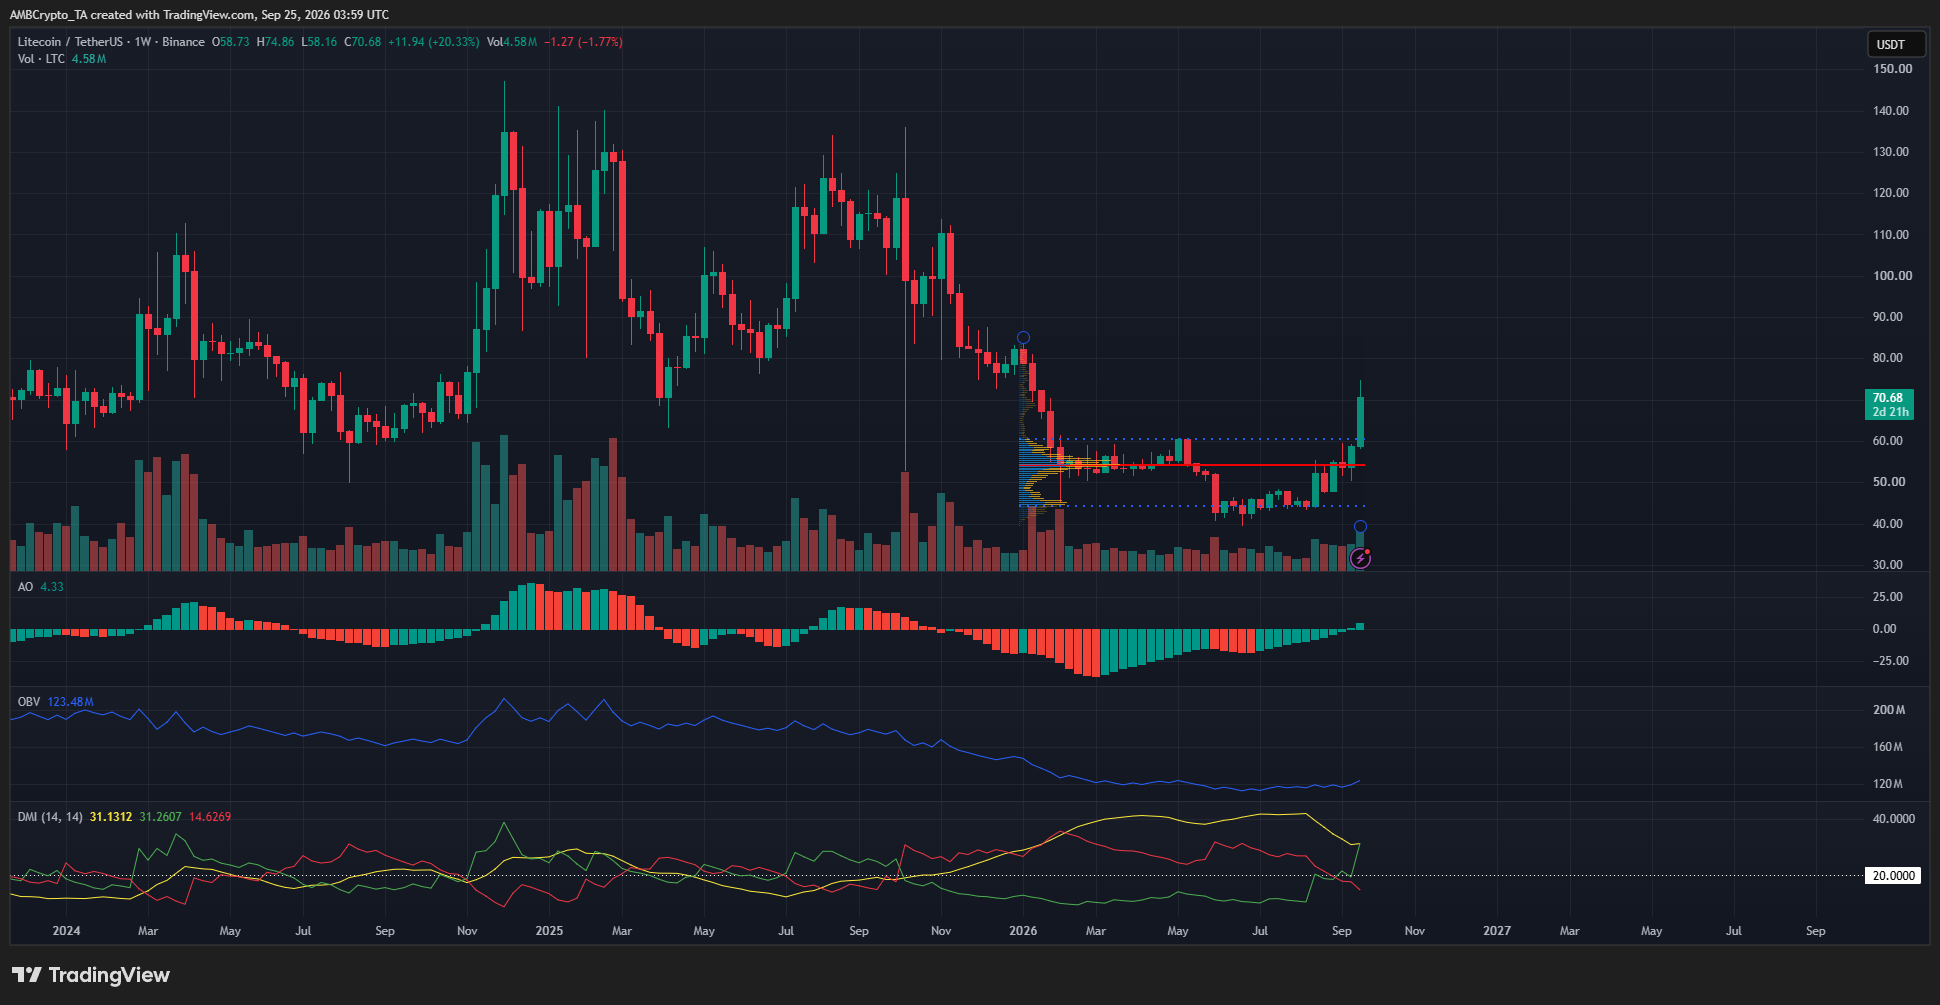
The Fixed Range Volume Profile was used to plot the volume profile from January’s high to the present day. It showed that the VAH (dotted blue) was at $60.50, a key swing level.
On the weekly chart, the Awesome Oscillator made a bullish crossover above the zero line, the first time the indicator flashed positive readings on this timeframe since October 2025.

The price also pierced the swing high at $60.61 made in May, flipping its weekly structure bullishly. The Directional Movement Index highlighted a strong uptrend in progress on the weekly timeframe.
Meanwhile, the OBV was still languishing near its multi-month lows stretching back to March. The weekly trading volume has not been explosive despite the bullish breakout. It could be a warning of weak buyer strength behind the move.
Despite the volume warning, however, Litecoin still maintains a bullish bias in the higher timeframes due to its rally past $60.
Traders’ call to action – Buy the pullback
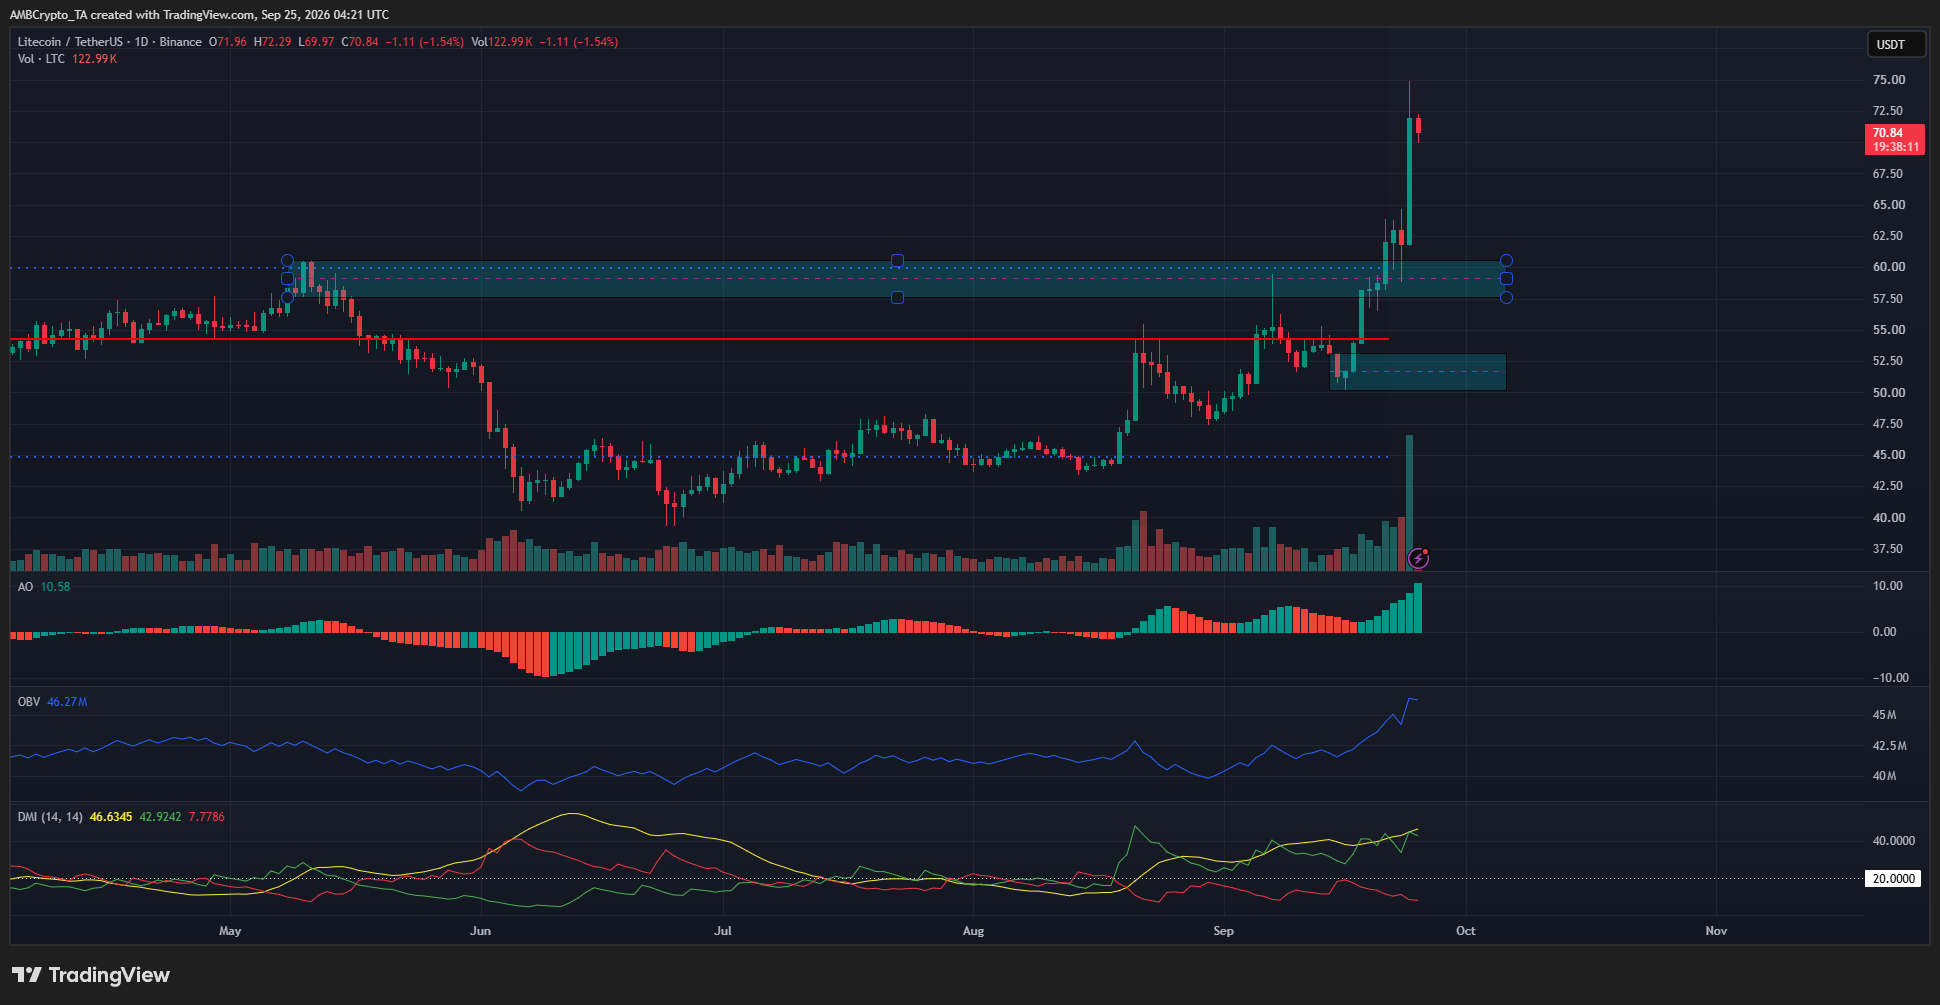
On the daily timeframe, the OBV made new highs and seemed to be far more encouraging. Other technical indicators also supported a bullish view. The price structure was also firmly bullish.
A pullback would offer a buying opportunity, given the trends across the daily and weekly timeframes.
The $60 and $52.50-levels are the key demand zones to watch out for on the daily chart. Swing traders and investors can wait for a bullish reaction from these areas to consider going long on Litecoin.
Final Summary
- Litecoin’s price rally past $60.61 marked a higher timeframe trend shift.
- A pullback towards $60 or $52 could offer swing traders and investors a chance to buy.





Be the first to comment