


What to know:
- ATS’s price surged 16% after breaking out of a multi-year triangle pattern, signaling a potential bullish reversal.
- Technical indicators like the Ichimoku Cloud and Bollinger Bands confirm strong bullish momentum.
- Analysts are watching the $0.60 target, while continued momentum could push ATS toward the $1.82 level.

Alltoscan (ATS) price surged after breaking out of a multi-year triangle pattern with strong volume, signaling a potential trend reversal. Technical indicators show accelerating bullish momentum for the ATS price, with traders targeting higher price levels as buyers continue driving the rally.
At the time of writing, ATS is trading at $0.05510 with a 24-hour trading volume of $414.12 million and a market capitalization of $12.2 million. After posting a 16.26% gain over the last 24 hours, everyone’s attention is on the question of whether the token could maintain its momentum or face a short-term pullback.
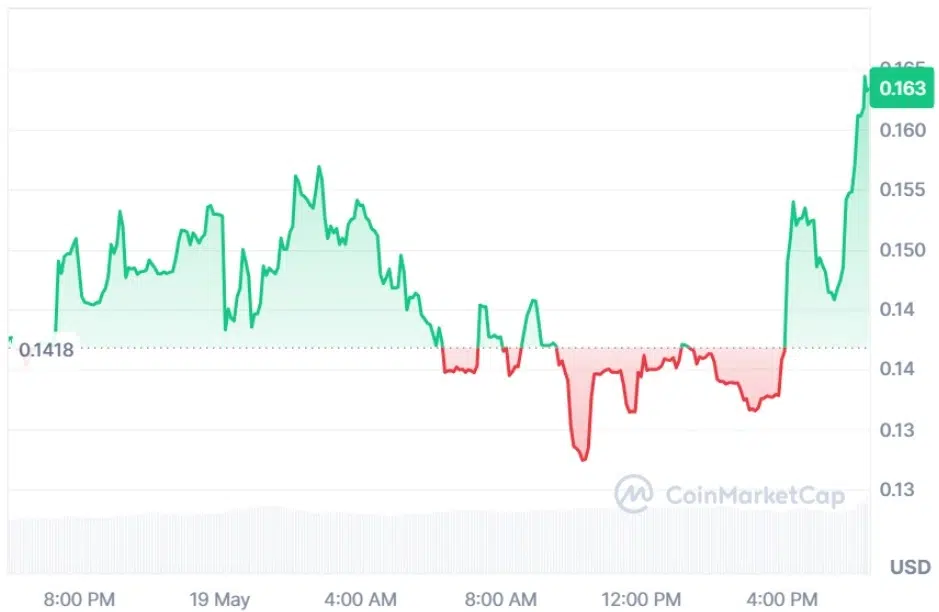

Source: CoinMarketCap

Also Read: Solana Price Faces Key Rejection at $98 as Downtrend Pressure Builds
ATS Price Surges After Multi-Year Triangle Breakout
Furthermore, the crypto analyst Crypto Patel highlighted that the ATS price has captured traders’ attention after breaking out of a massive multi-year triangle pattern with powerful trading volume, signaling a potential trend reversal.
The breakout comes after months of consolidation, with analysts calling it one of the strongest technical setups in the altcoin market. Buyers are now stepping in aggressively as momentum rapidly accelerates.
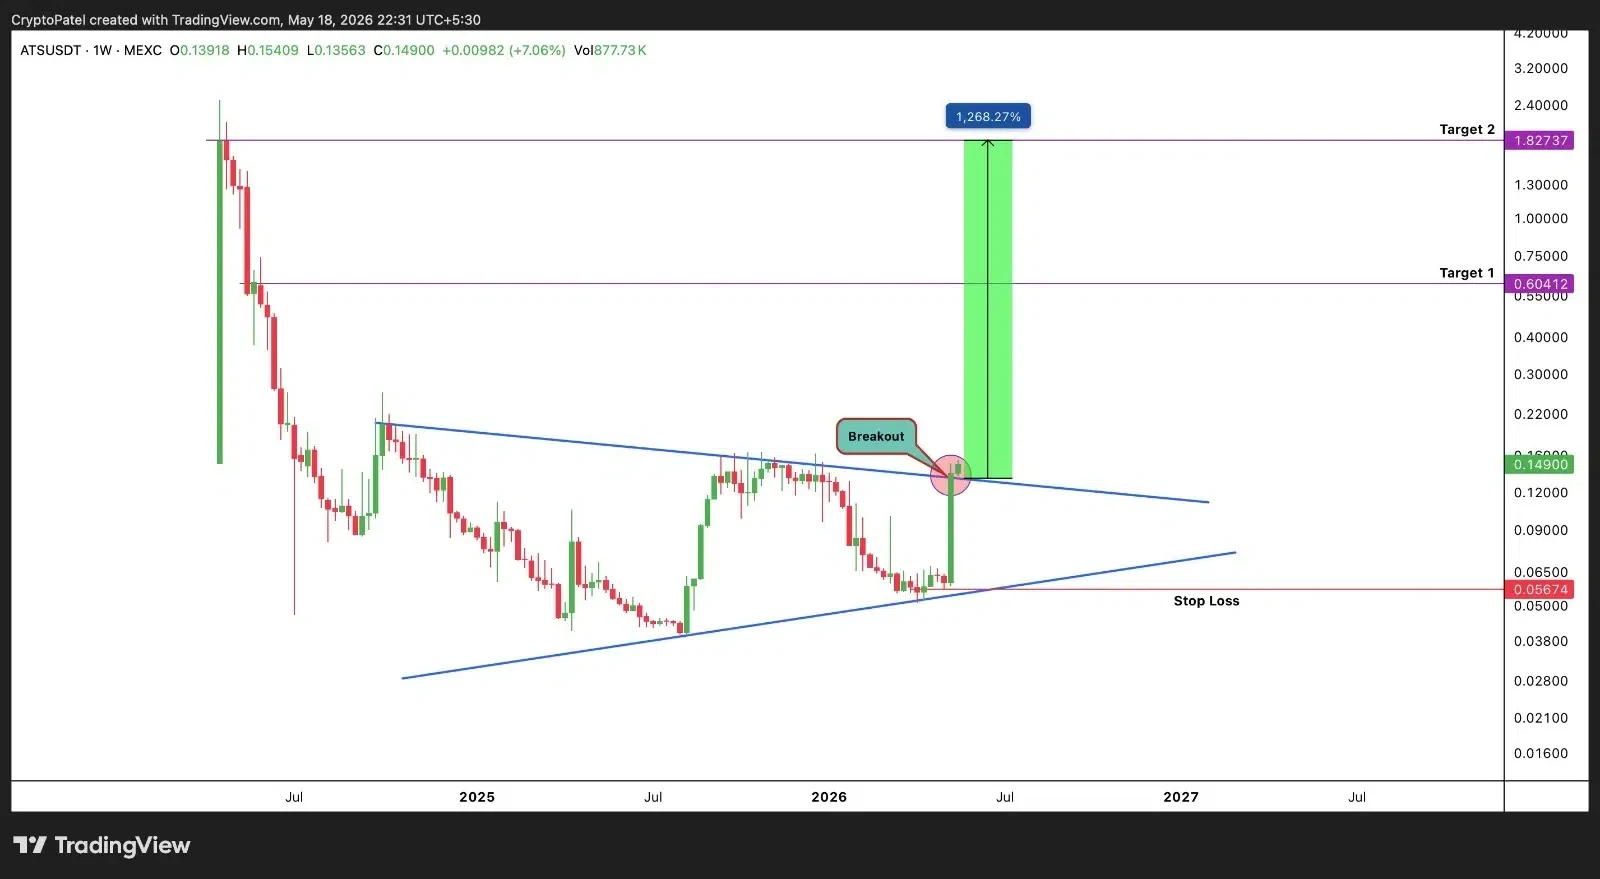

Source: Crypto Patel’s X Post
The market observers have been looking out for a first swing towards $0.60, with further bullish strength indicating a potential upside move for the ATS price as high as $1.82.
The price level of $0.056 is particularly important from the perspective of risk management, with continued momentum expected to lead to a more extensive rally.
Technical Indicators Point to a Strong Breakout
According to TradingView, the ATS price marks a dramatic change in trend: from an extended period of markdown to an explosive and momentum-filled breakout.
In early 2026, the ATS price fell below the thick Ichimoku cloud and moved downwards continuously until it found itself in a confined accumulation range of $0.06500. The consolidation phase is marked by a compression of the Bollinger Bands.

Source: TradingView
The ATS price experienced a violent spike in mid-May, going almost vertically up towards $0.14637, breaking through the resistance cloud overhead.
This caused the bands to widen because of the price moving close to the upper band, which is at $0.15058. The move was fueled by the sharp vertical move of the lagging Chikou Span indicator.
This article contains market analysis and price predictions. These are not guarantees. Crypto markets are volatile. Always DYOR. Not financial advice.
Also Read: SUI Price Nears Critical Support, Eyes Possible Rally Toward $1.42

Be the first to comment