



Avalanche price has allowed the coin to reach impressive highs; however, the rejection near the $11.40 resistance level has brought volatility back into play, due to increased volume and derivatives activity.
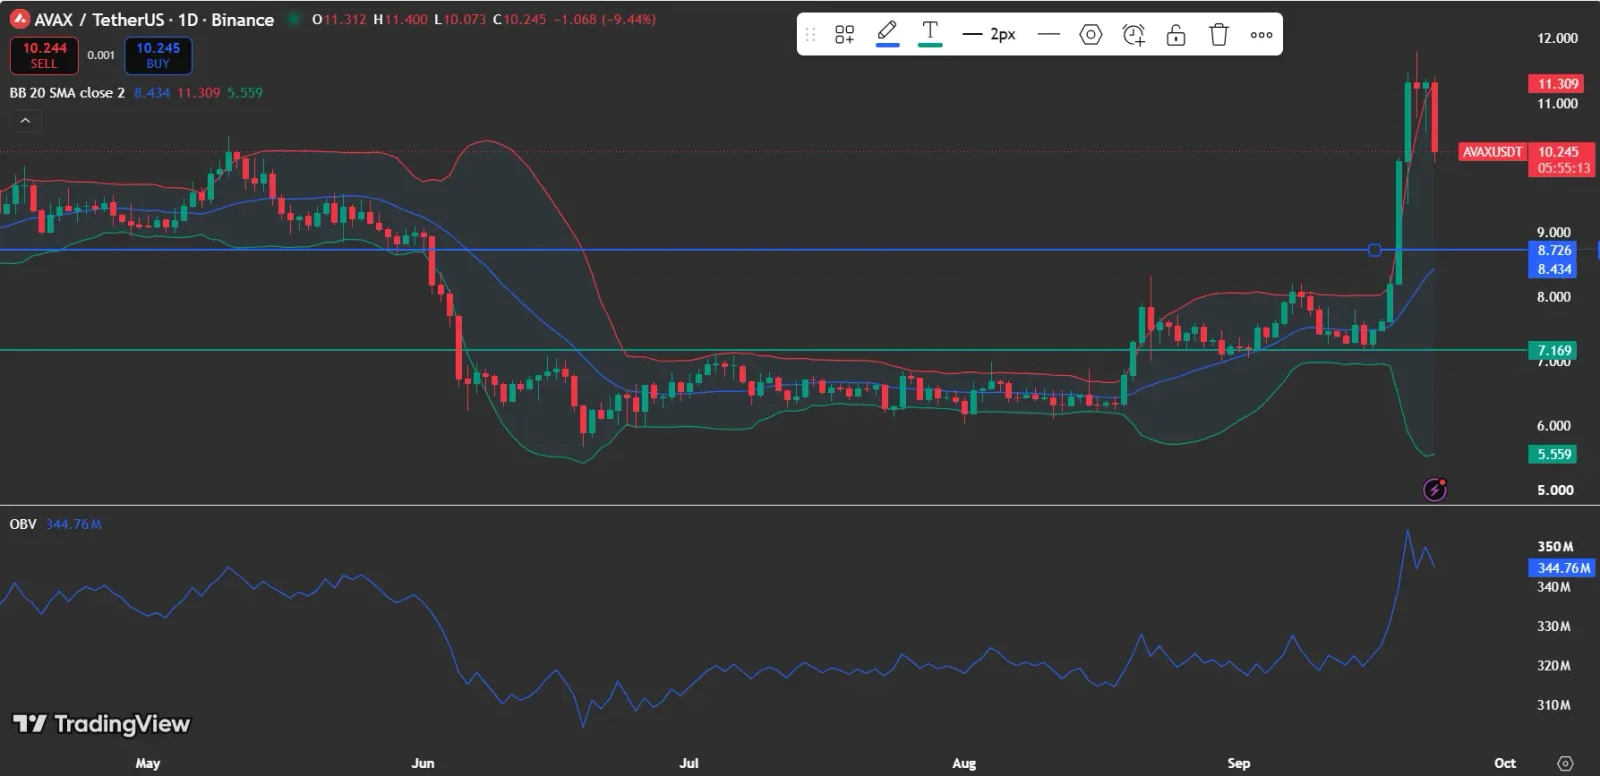
As per the latest readings, the price of Avalanche (AVAX) stands at $10.245, marking a 9.44% decline from the previous day, as depicted through the TradingView graph. It has managed to touch a high of $11.40 before the pullback.
Also Read: Avalanche Price Holds $7.43 Support as Michigan Partnership Expands Adoption
What Is Driving Attention Toward Avalanche?
The focus has now shifted to Avalanche’s blockchain technology and its stablecoin use cases. According to an official blog post from Avalanche, the stablecoin trial conducted by Hyundai Card on the Avalanche blockchain network has reduced transfer times by more than 96%.

Also, according to the blog post, Hyundai is looking into how quicker transfers may reduce idle liquidity.
Why Is the Avalanche Price Retracting From $11.40?
AVAX used to trade mainly below $8 before making an upward move in September. The TradingView analysis shows the token rising above the $8.73 resistance level and making a swift move towards $11.
The current correction shows a rejection from the recent upward move, although the overall chart pattern remains above the previous breakout level. Thus, the $8.73 level will be key in case selling continues.
At the moment, the $11.40 level is the primary resistance level on the chart. If AVAX is able to break out above the resistance level, it will put the recent high back in focus.
What Does the Avalanche Price TradingView Chart Reveal?
As revealed from the daily chart, the asset, AVAX, is being traded above its 20-day Bollinger Band middle line, which stands at $8.434. The upper Bollinger Band is at $11.309, whereas the lower band is at $5.559.
AVAX recently moved above the upper band during its sharp increase, indicating a strong price expansion within a short period. This pullback brings the price back toward the upper-band region but has not negated the trend that stands above the middle band line.
On the other hand, the chart reveals the OBV figure to be 344.76 million after the significant jump in the latest rally. The rise in OBV alongside the price increase shows that trading activity strengthened during the recent move.
Also Price: Avalanche Price Faces $7.80 Resistance After POSCO Blockchain Update
Why Is Avalanche Open Interest on the Rise?
As per CoinGlass, the Avalanche open interest saw a considerable increase in tandem with the latest rally in the price of Avalanche. The open interest has gone up from approximately $300 million to over $500 million, crossing above $500 million between September 21-23.
The reason behind this uptick is the expansion of derivatives trading during the price appreciation of Avalanche. Hence, the price action at present carries a lot of significance as an increased position in futures can imply greater price volatility as traders adjust or close their positions.
Therefore, the last price rejection looks like it took place after a considerable expansion in derivatives trading.
How Did the Avalanche Price Trading Volume Change?
According to CoinGlass, the volume increased significantly. The daily volume amounted to roughly $2.5 billion by September 22, which was quite high compared to the volume seen in July and August.
The significant increase in the volume took place when the AVAX price approached the $11 mark, meaning that the breakout was witnessed by increased participation from the market.
In this way, the volume plays the role of an important confirmation factor for the next move. Increased volume at key price levels would indicate continued trading activity around those levels.
What Do Avalanche Price Liquidations Reveal?
According to the CoinGlass liquidation chart, there has been a notable increase in liquidation activity around the latest price action. Large red bars, which represent short liquidations on the chart, appeared as AVAX approached the $11 mark, while long liquidation activity was also visible at several points across the period.
Therefore, one can conclude that the fast growth of prices has led to considerable positioning pressure in the perpetual futures market. Considering the high open interest levels, further sharp price movements could increase liquidation risk.
Also Read: Avalanche Price Eyes $8.17 Breakout as Momentum Builds
What Should Avalanche Price Movements Monitor Next?
For AVAX, the closest resistance level is at $11.40, representing the latest high. The key level to monitor on the downside is the $8.73 breakout area, while the TradingView middle Bollinger Band level is near $8.43.
A price move above $11.40 would bring the recent high back into focus. If the price breaks down through $8.73, it would weaken the existing breakout structure and shift attention toward lower support levels.
On the DeFiLlama graph, it is clear that the total value locked (TVL) of Avalanche has climbed up towards $640 million before easing toward the $600 million area. The chart also displays active addresses and transaction activity, providing additional network-level context alongside the TVL movement.
Also Read: Avalanche Price Holds Near $6.35 With Tokenized Fund as Catalyst
This article contains market analysis and price predictions. These are not guarantees. Crypto markets are volatile. Always DYOR. Not financial advice.



Be the first to comment