



Bitcoin Cash (BCH) is consolidating within a tightening triangle as momentum improves and buyers defend the broader recovery structure. Derivatives activity remains cautious, while expanded wallet support could improve accessibility and market participation. A decisive breakout above resistance may strengthen the bullish setup and attract renewed attention.
BCH Price Setup Signals Strong Bullish Move Ahead
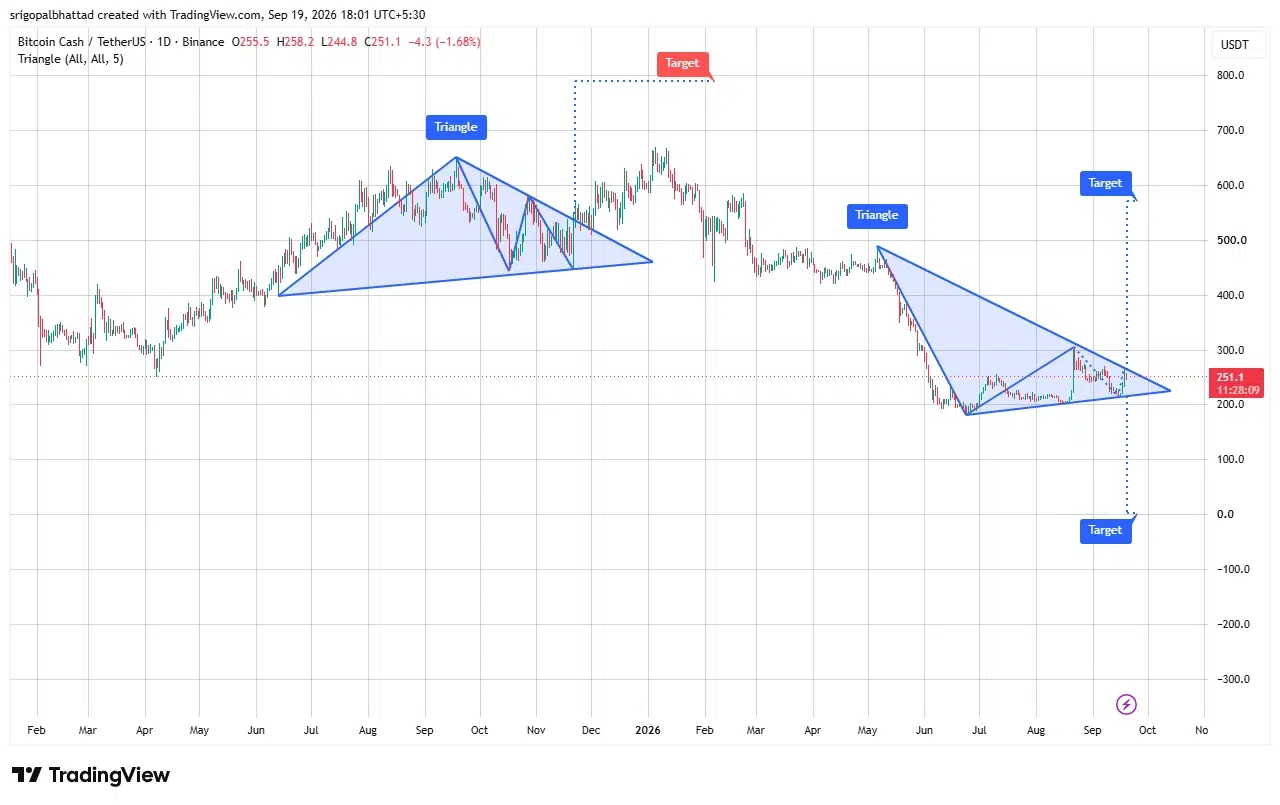
BCH looks set to make a move on the upside since the coin is now consolidating in a big triangle at $250.
According to the crypto analyst Crypto With Gopal, BCH is trading between falling resistance at $300 and rising support at $200–$210. It means that BCH is now at a critical technical point in time.
Source: Crypto With Gopal’s X Post

BCH is currently priced at $255.07 following several weeks of ranging from July to August in the range of $200-$220. The coin then broke upwards through $300 towards the end of August but quickly reversed.
Recent strong green candles have propelled BCH upwards and brought it nearer to the upper side of the triangle.
Also Read: Bitcoin Cash (BCH) Ascending Triangle Suggests Possible Surge Toward $1200
BCH Triangle Creates Key Technical Decision
The triangle shape indicates a compression phase during which there were opposing trends. Seller participants have been able to defend the price level of $300 multiple times, while buyer participants have been able to maintain higher levels of support in the range of $200-$210.
With the narrowing of such levels, volatility may increase once the break from this pattern occurs.
Breaking above $300 will confirm the bullish formation and set up for a push towards the target price on the chart. But a clear break higher is required in order to trigger such an event.
On the other hand, breaking below the lower line at $200-$210 will undermine the setup completely and invalidate any bullish formation.
RSI and MACD Point Toward Improving Momentum
According to the TradingView chart analysis, improving momentum is indicated by the momentum indicators as well. The RSI currently stands at 58.44 and is trading above its signal line without getting into overbought territory.
This means that buyers are in charge without allowing momentum to reach an extremely bullish zone. At the same time, the MACD has generated a new bullish crossover.

Source: TradingView
The MACD histogram is now turning green, and its line has crossed above zero. In total, these signals show that the buying strength has increased after the recovery of BCH.
Momentum oscillators are very fickle and change their position very fast, which means that traders will still look at the price level of $300 for confirmation.
BCH Derivatives Activity Signals Caution
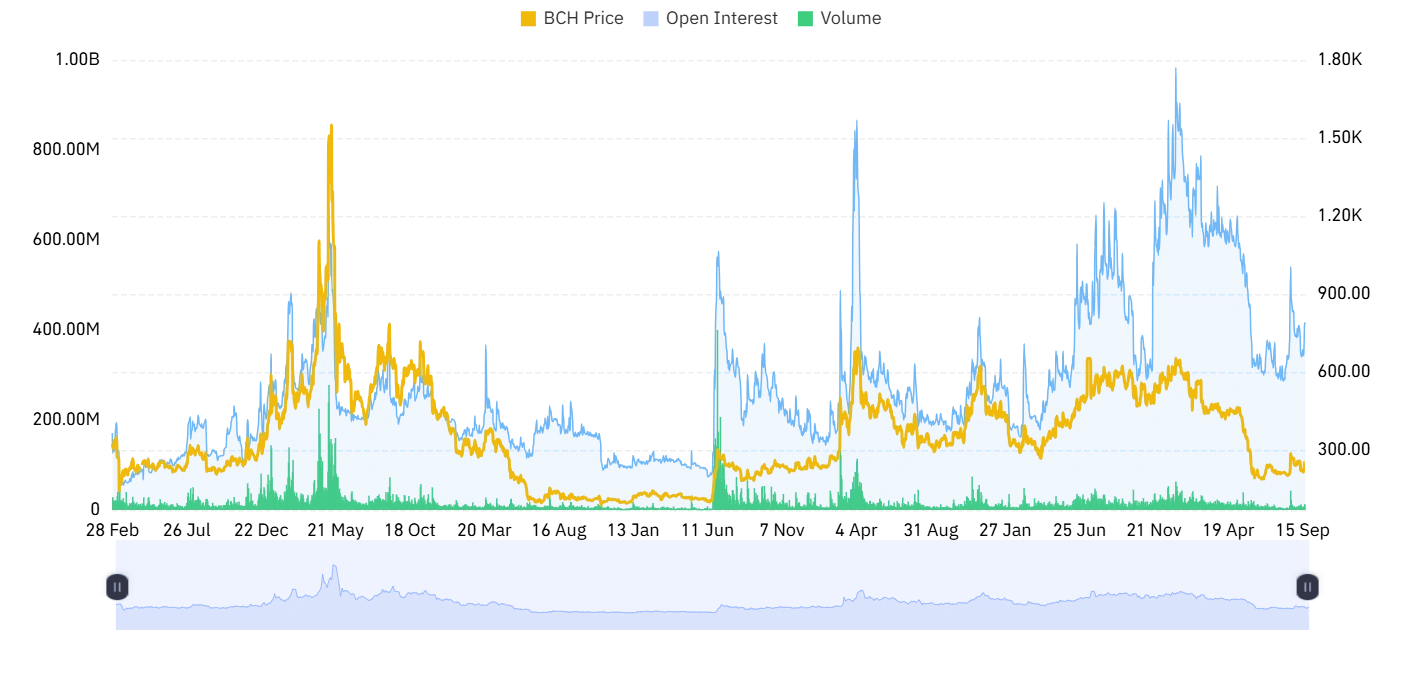
The Coinglass data brings a slightly conservative approach to the technical forecast. Trading volume for the 24-hour derivatives has decreased by 19.19% to $355.11 million.
Open interest has dropped by 1.09% to $413.05 million. The drop indicates reduced involvement from margin traders, implying that the current price rebound is happening amid low derivatives trading activity.
Source: Coinglass
Low levels of derivatives trading activity do not mean that the bull chart pattern is not valid, although it could weaken the impact of the breakout if participation does not resume.
A breakout above $300 with increased volume and open interest would be a more convincing signal. In the meantime, mixed messages mean that BCH is stuck between two extremes.
My Wallet Adds Bitcoin Cash Support
Additionally, separate ecosystem advancements may help enhance visibility of Bitcoin Cash. According to the data by My Wallet, Bitcoin Cash is added among other coins like Bitcoin, Arc, Litecoin, and Dogecoin.
It means that the coin is now available for purchase, trading, sending, receiving, and holding, just like other coins within the platform.
Wallet extension arrives as BCH is reaching a significant technical level, bridging the market formation with overall asset availability.
Higher availability does not necessarily mean high demand or a price breakout, but increased availability may help in participating in trading if utilized by traders. For traders, what matters now is if BCH is able to take back the $300 level.
What Happens Next for the BCH Price?
For BCH, the technical decision point is obvious. Any breakout over the $300 level could validate the bullish formation on the chart and allow traders to focus on its potential target; rejection could maintain the token within the consolidation area.
A downside breakout below the $200-$210 level would invalidate the pattern. Until then, BCH is under compression.
Also Read: BCH Price Outlook: Bulls Could Push it to $230 if $214 Support Holds Strong
This article contains market analysis and price predictions. These are not guarantees. Crypto markets are volatile. Always DYOR. Not financial advice.


Be the first to comment