



Cap [CAP] surged roughly 23% in the past day as bullish sentiment in the market has remained on the higher side.
The perpetual market has played a role in the rally, with the Funding Rate and Open Interest confirming that there is buying pressure in the market.
The Funding Rate presently has a reading of 0.0050%, while Open Interest rose roughly $6.16 million to $32 million at press time. When the Funding Rate is mildly positive and Open Interest and the asset price are rising, it confirms that there are more long positions in the market.
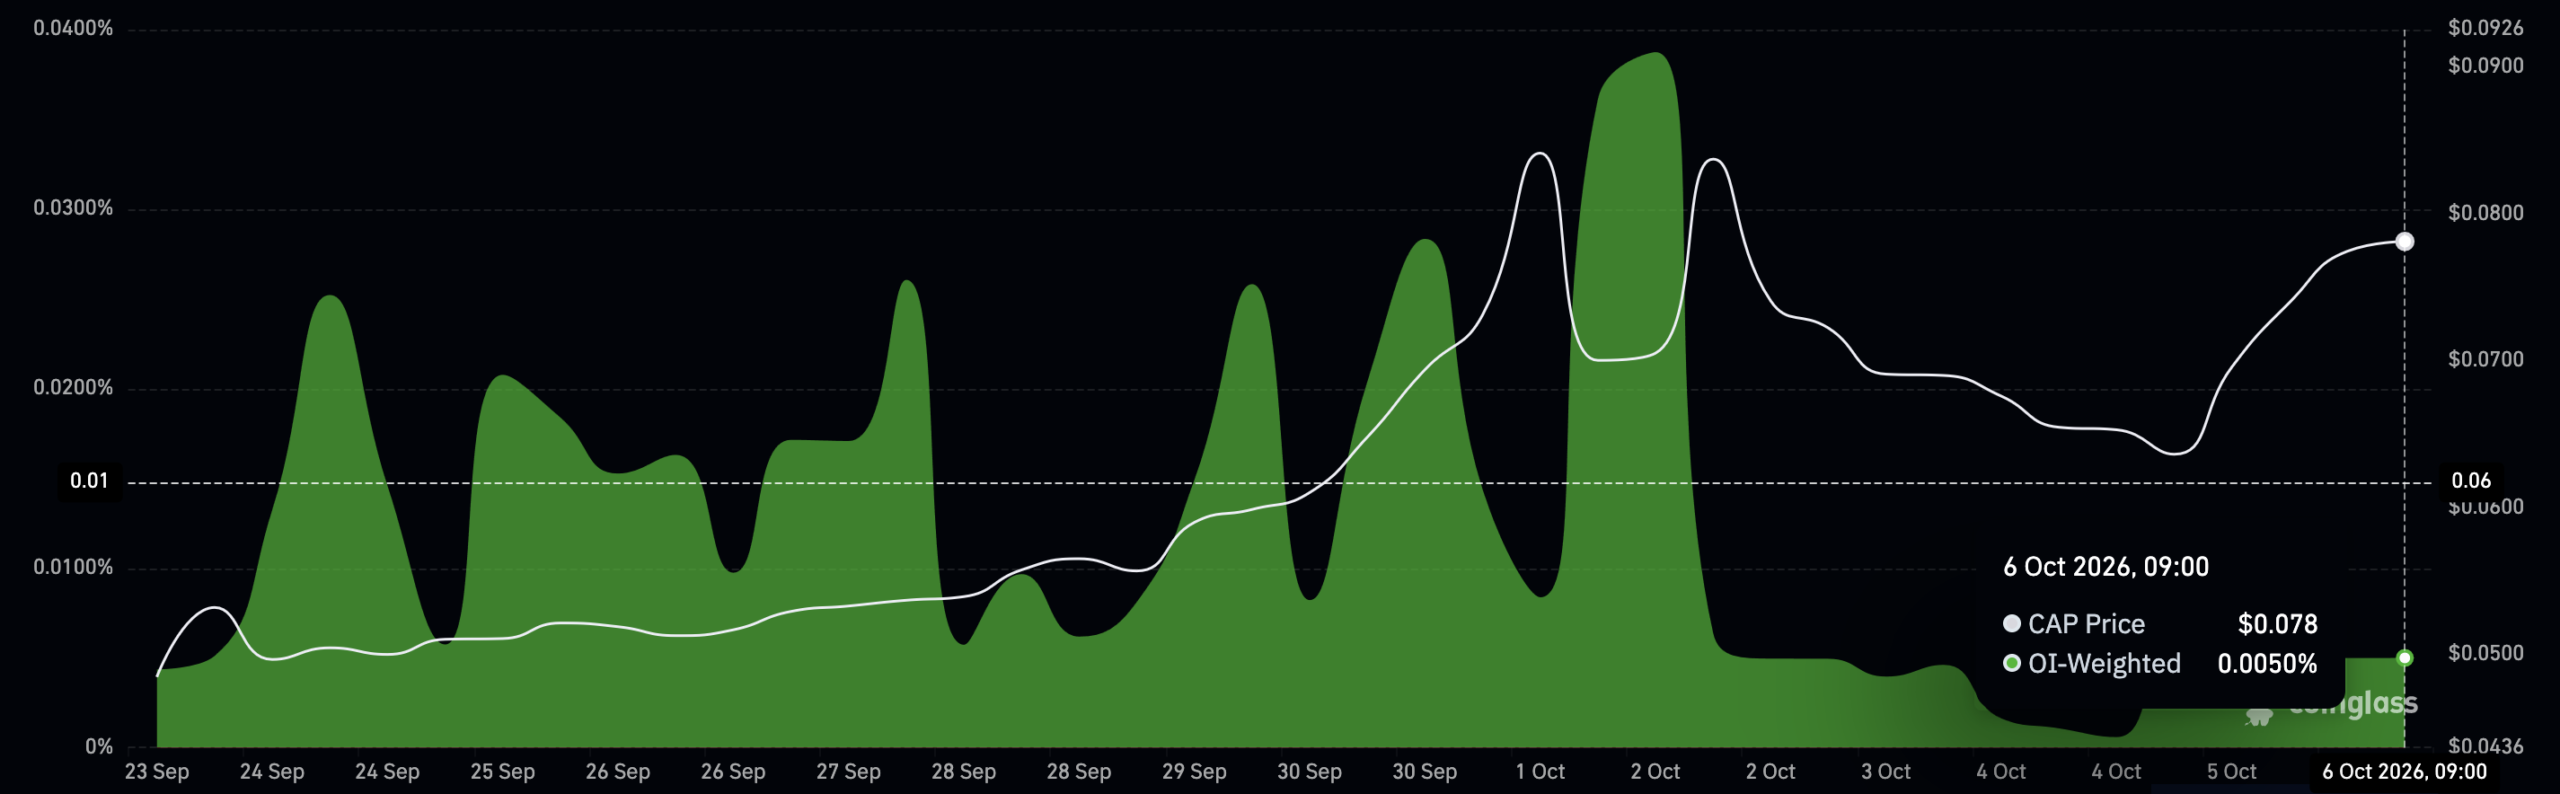
These longs are paying the funding fee and keeping the markup price between the Spot and perpetual market prices for CAP minimal in the market.

Traders have increased capital flow into the perpetual market over the same period, with about $44.7 million in inflows and netflow at $1.21 million, suggesting they are actively positioning for a near-term rally.
Buying pressure strengthens across the market
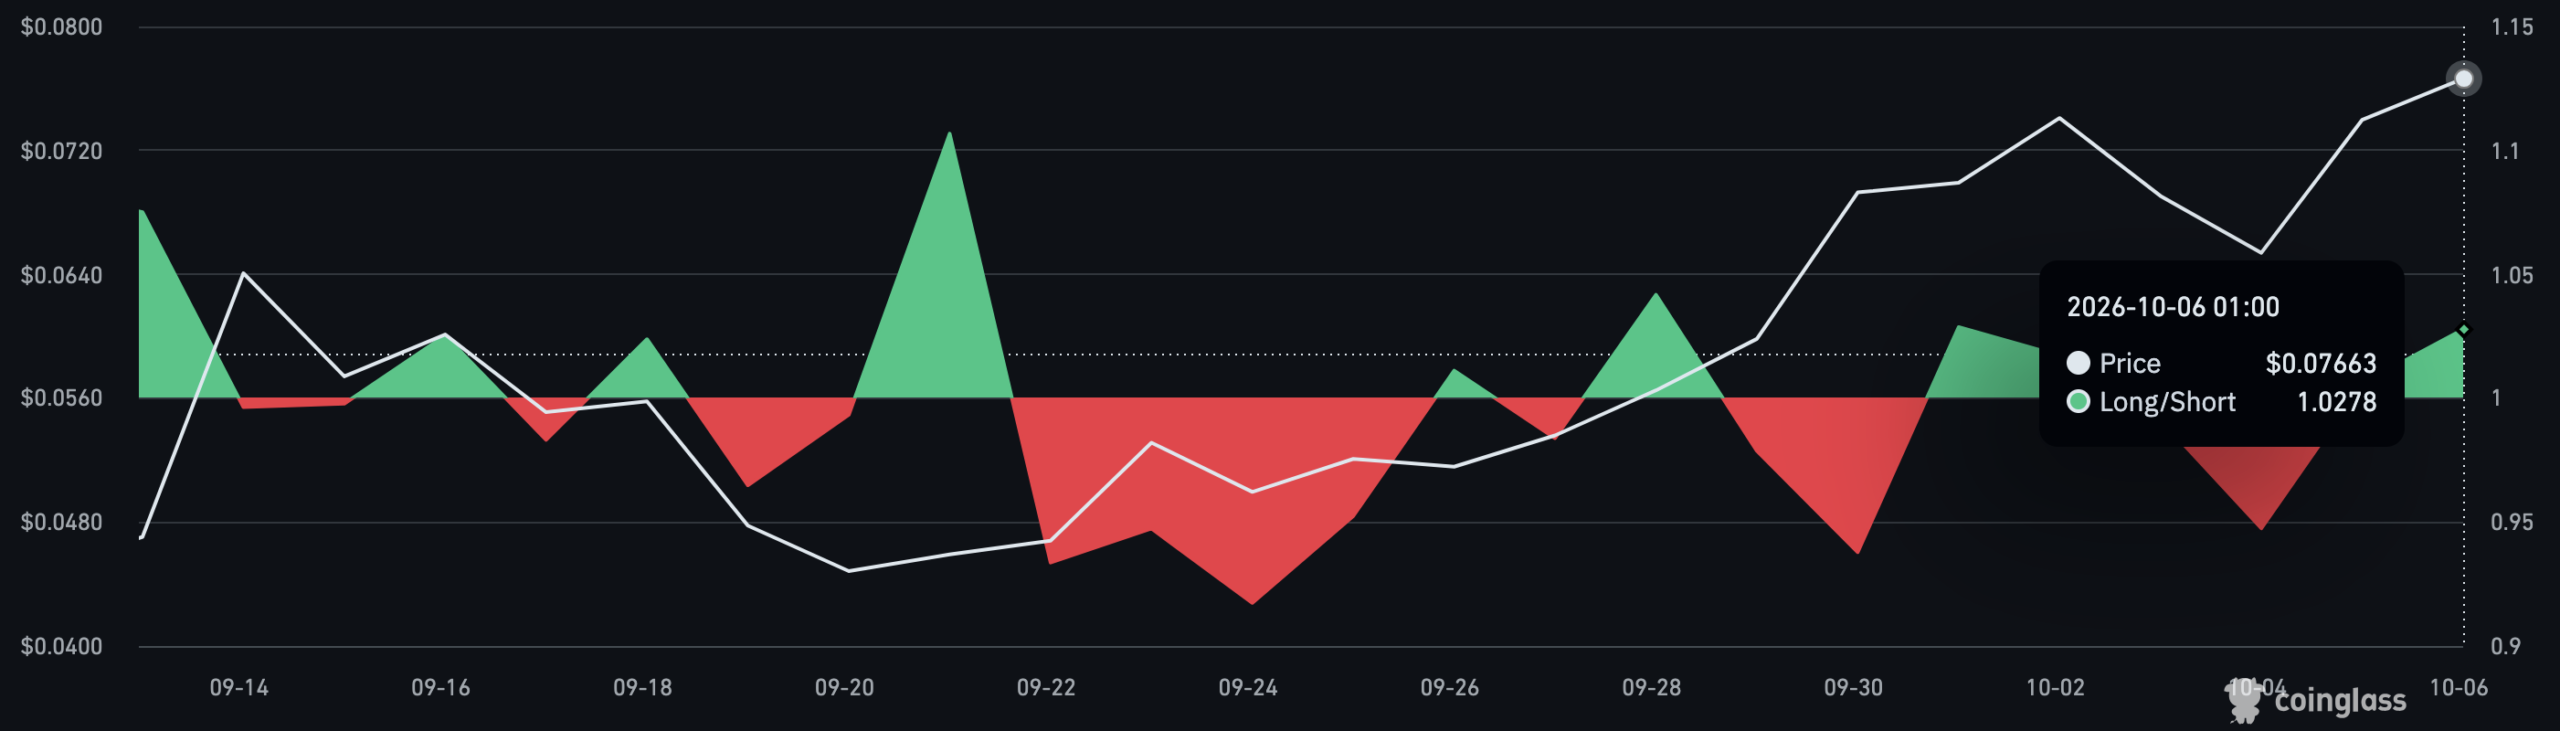
The Taker Buy/Sell Ratio has been positive, with more buy volume than sell volume within the 24-hour window.
Taker Buy presently has a reading of around 1.02, according to data from CoinGlass, implying that there has been more buying volume as it trades above 1.
Presently, the total volume in the perpetual market has a reading of $102.67 million. On a broader level, there has been a rise in trading volume across the market.
The total volume across the Spot and perpetual markets surged to roughly $126 million, with volume up over 450% in the past day.
When there is a rise in volume alongside price, it confirms that the bulls’ strength in the market is on the higher side and that the asset is likely to continue in its upward direction.
Short traders face heavier losses as CAP rises
The liquidated capital analysis shows that the market is tilted in favor of the bulls, as short traders have accumulated the most losses.
The liquidated capital analysis for the 6th of October shows that while longs have lost a meager $8,260, short traders have lost roughly $99,300 within the same period.
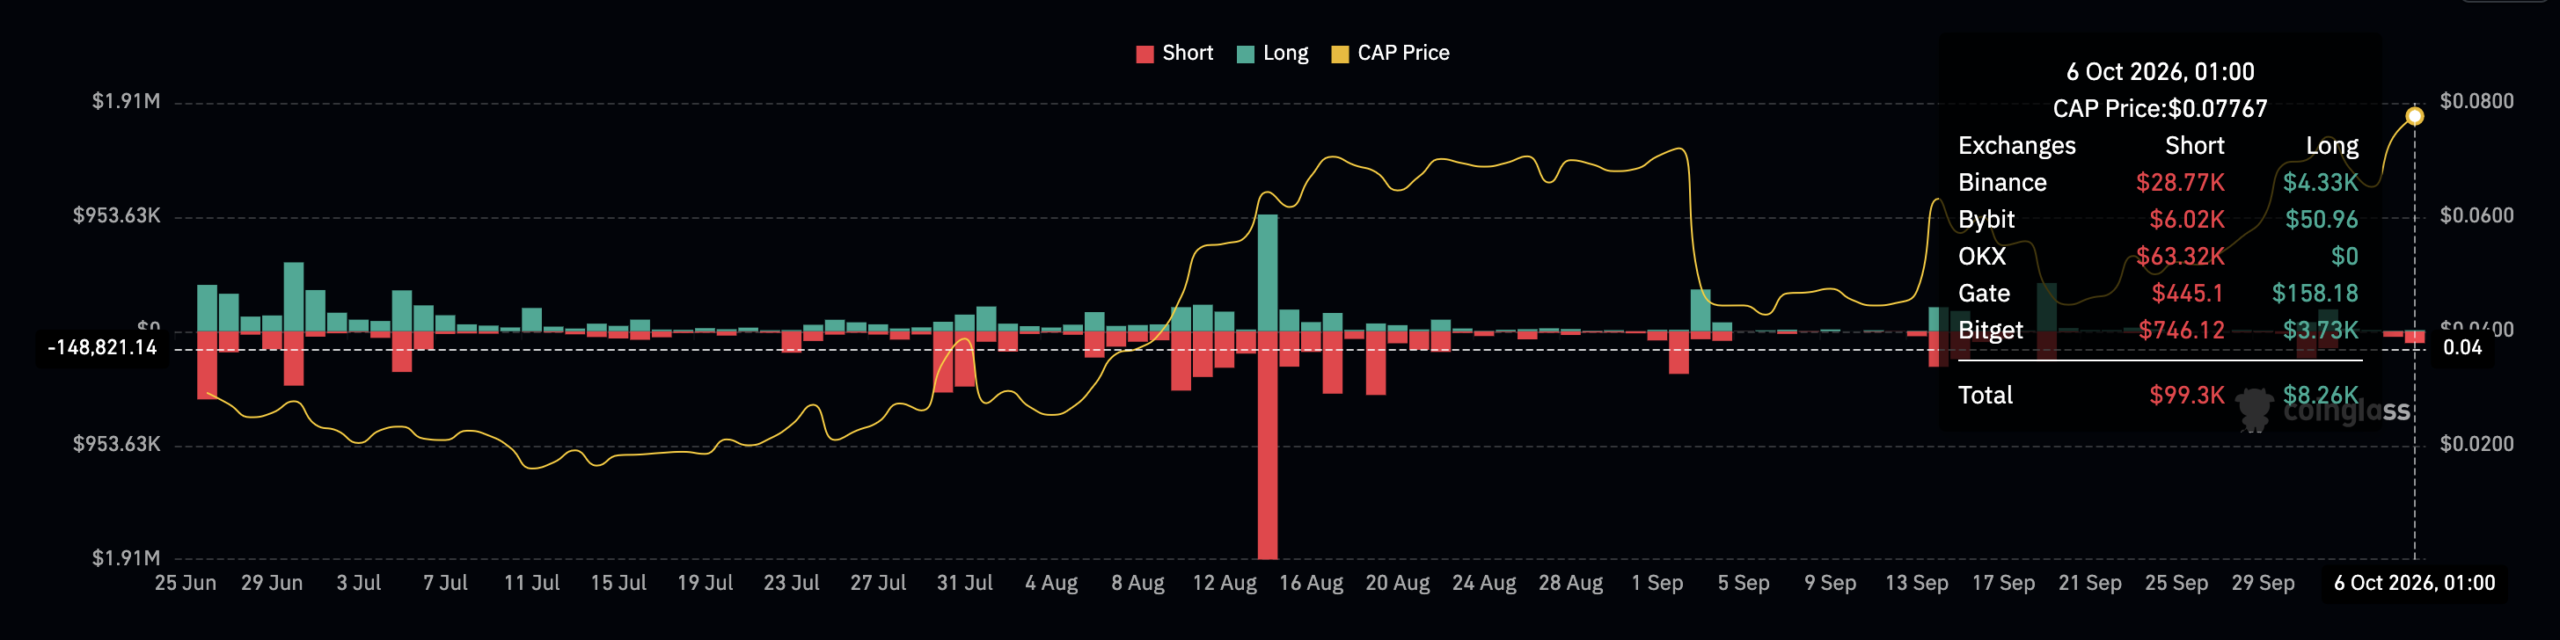
This implies that CAP’s short traders have lost 12 times more than longs so far today, suggesting the scale of bullish activity in the market.
In fact, a similar buildup occurred on the 5th of October, when shorts lost roughly $47,160 in the past day, while longs lost $3,440, giving shorts 13.7 times more losses than longs.
For now, the market signals a strong bullish presence, and investors betting against a rally should be cautious, as short losses have dominated.
Final Summary
- CAP’s 23% rally is supported by rising Open Interest, positive Funding Rate and strong buying activity in the perpetual market.
- Short traders have recorded significantly higher losses than longs, highlighting strong bullish pressure behind CAP’s price surge.




Be the first to comment